Ethereum (ETH/USD) extended its recent pullback away from its recently-established multi-year high around the 1350.88 level as traders continue to take profits and reduce exposure to market risk. Stops were recently elected below some downside retracement areas during the pullback, including the 1224, 1194.44, 1162.21, 1157.23, and 1145.37 levels. If ETH/USD extends its pullback lower, downside retracement areas and levels of potential technical support include the 1053.31, 1002.84, 982.99, 976.37, 954.16, 941.22, 917.03, 915.48, 902.24, 895.33, 869.22, 860.69, 856.83, 844.44, 831.94, 828.97, 812.73, 783.02, 770.03, 763.66, 750.28, 745.01, and 723.97 areas. During ETH/USD’s recent move higher to multi-year highs, Stops were recently elected above the 1072.78, 1133.44, 1163.93, 1176.28, 1225.30, and 1230.73 areas, and selling pressure intensified below these areas during the pullback. Notably, these levels represented technically significant upside price objectives related to historical buying pressure around the 215.16, 625.01, 370.50, 480.08, 530.32, and 310.79 areas.
Strong Stops were also recently elected above the 819.23, 877.81, and 879.23 levels during the sharp climb, upside price objectives also related to previous buying activity around the 625.01 and 530.32 areas, and traders are curious to see how price activity reacts around these levels. If ETH/USD is able to resume its recent upward buying pressure, additional upside price objectives include the 1381.03, 1439.98, 1582.86, and 1665.31 areas. Additional significant Stops were also recently elected above the 615.19, 637.79, 668.87, 679.78, and 698.88 area during the march to successive multi-year highs, and traders are curious to see how supportive those levels become during pullbacks lower. Traders are observing that the 50-bar MA (4-hourly) is bullishly indicating above the 100-bar MA (4-hourly) and above the 200-bar MA (4-hourly). Also, the 50-bar MA (hourly) is bullishly indicating above the 100-bar MA (hourly) and above the 200-bar MA (hourly).
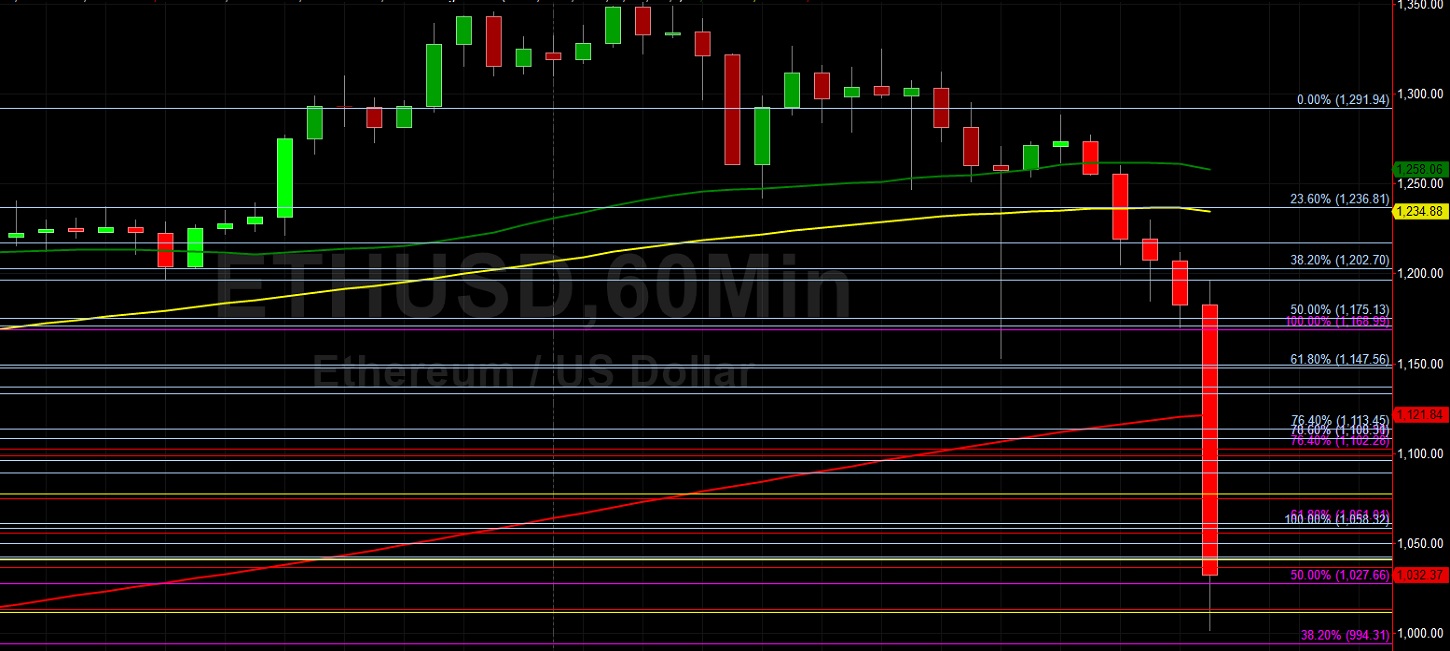
Price activity is nearest the 100-bar MA (4-hourly) at 915.56 and the 200-bar MA (Hourly) at 1221.93.
Technical Support is expected around 792.40/ 766.54/ 729.88 with Stops expected below.
Technical Resistance is expected around 1381.04/ 1419.96/ 1439.98 with Stops expected above.
On 4-Hourly chart, SlowK is Bearishly below SlowD while MACD is Bearishly below MACDAverage.
On 60-minute chart, SlowK is Bearishly below SlowD while MACD is Bearishly below MACDAverage.
Disclaimer: This trading analysis is provided by a third party, and for informational purposes only. It does not reflect the views of Crypto Daily, nor is it intended to be used as legal, tax, investment, or financial advice.