Ethereum (ETH/USD) gained marginal ground early in today’s North American session as the pair moved higher to the 745.59 area after trading as low as the 726.71 area during the European session, with the intraday low above the 723.50 area that represents the 50% retracement of the appreciating range from 688 to 759. The next downside retracement levels in this depreciating range include 715.12 and 704.76. Chartists are observing that the 50-hour and 100-hour simple moving averages continue to converge, evidencing some recent sideways trading activity. Upside price objectives include the 770.03, 787.22, and 828.97 areas. Additional technical support has also recently emerged around the 717.00 area, right around the 50% retracement of the recent depreciating range from 747.00 to 688.00.
Significant Stops were recently elected above the 615.19, 637.79, 668.87, 679.78, and 698.88 area during the march to successive multi-year highs. Additional upside price objectives include the 819.23, 879.23, 910.42, 939.22, and 985.15 areas. Following the pair’s recent moves to successive all-time highs, downside retracement levels and areas of potential technical support include the 702.42, 683.66, 667.31, 653.74, 628.40, and 601.94 levels. ETH/USD gained approximately 21% month-to-date in December, and closed 2020 with approximately a 450% gain. Traders are observing that the 50-bar MA (4-hourly) is bullishly indicating above the 100-bar MA (4-hourly) and above the 200-bar MA (4-hourly). Also, the 50-bar MA (hourly) is bullishly indicating above the 100-bar MA (hourly) and above the 200-bar MA (hourly).
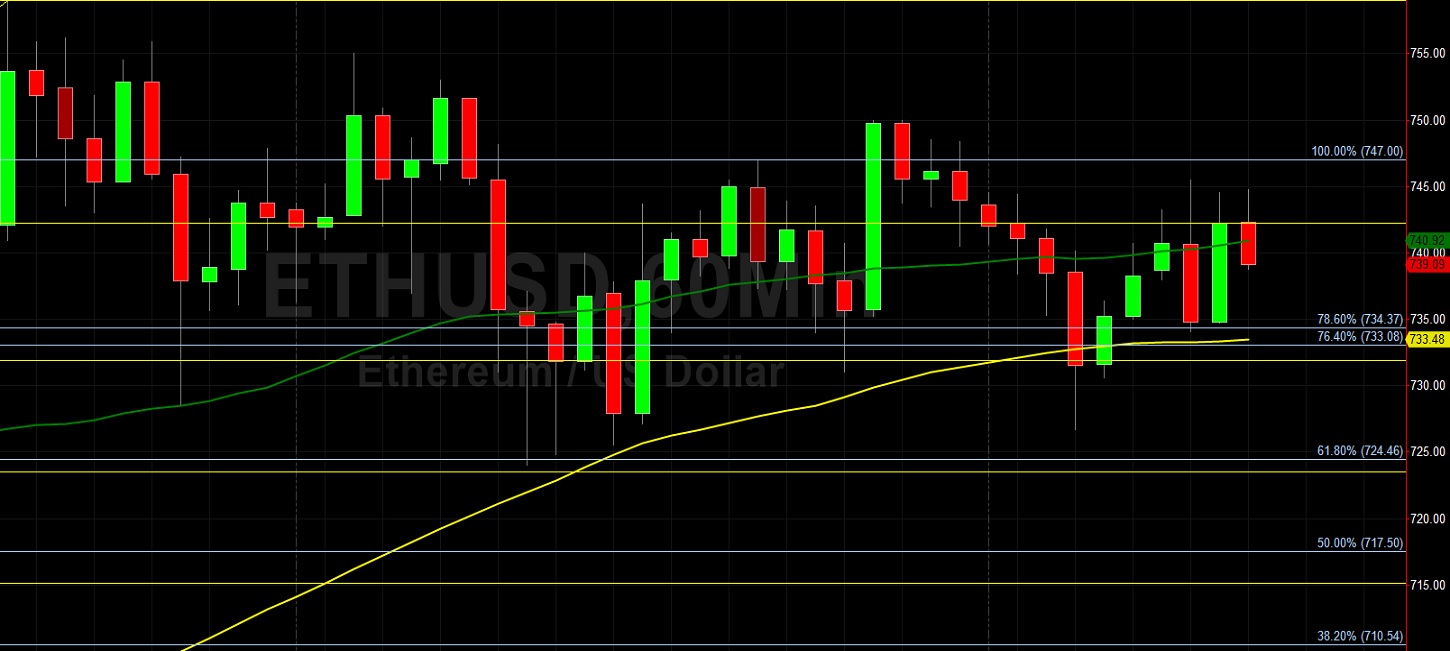
Price activity is nearest the 50-bar MA (4-hourly) at 687.85 and the 50-bar MA (Hourly) at 740.94.
Technical Support is expected around 699.32/ 612.33/ 530.32 with Stops expected below.
Technical Resistance is expected around 759.00/ 819.23/ 877.71 with Stops expected above.
On 4-Hourly chart, SlowK is Bearishly below SlowD while MACD is Bearishly below MACDAverage.
On 60-minute chart, SlowK is Bullishly above SlowD while MACD is Bearishly below MACDAverage.