Bitcoin (BTC/USD) rampaged higher early in today’s North American session as the pair appreciated to the 31623.00 area after trading as low as the 29039.00 area during the Asian session, following recent strong buying activity from the 28700 level. Significant Stops were elected above several key levels during the pair’s acute ascent. Traders triggered Stops above the 29395.73 level, technical resistance related to buying pressure that originated around the 9819.83 area. A series of Stops were then elected above upside price objectives including 30140.96, 30474.28, 30840.82, 31162.52, 31424.78, and 31609.99. Chartists observe that BTC/USD’s new lifetime high of 31623 is a test of the 31609.89 area that is an upside price objective related to buying pressure that originated around the 17580.00 area. Sizable Stops were also elected above the psychologically-important 30000 figure during the move higher following Stops that were recently elected above the 29119.99 area, an upside price objective related to buying pressure that emerged around the 3858 area earlier this year.
Stops were previously triggered above the 27079.78, 27388.28, 27769.99, and 28387 levels during the pair’s ascent. Additional upside price objectives include the 31694.55, 34446.27, 34697.35, 34937.10, 35300, 35442.74, 35641.61, 35943.73, 36480.83, and 36854.45 areas. Following the pair’s recent moves to successive all-time highs, downside retracement levels and areas of potential technical support include the 30242.29, 29388.13, 28697.78, 28308.85, and 27537.13 areas. BTC/USD traded up more than 44% in January, and closed 2020 with a gain of approximately 292%. Traders are observing that the 50-bar MA (4-hourly) is bullishly indicating above the 100-bar MA (4-hourly) and above the 200-bar MA (4-hourly). Also, the 50-bar MA (hourly) is bullishly indicating above the 100-bar MA (hourly) and above the 200-bar MA (hourly).
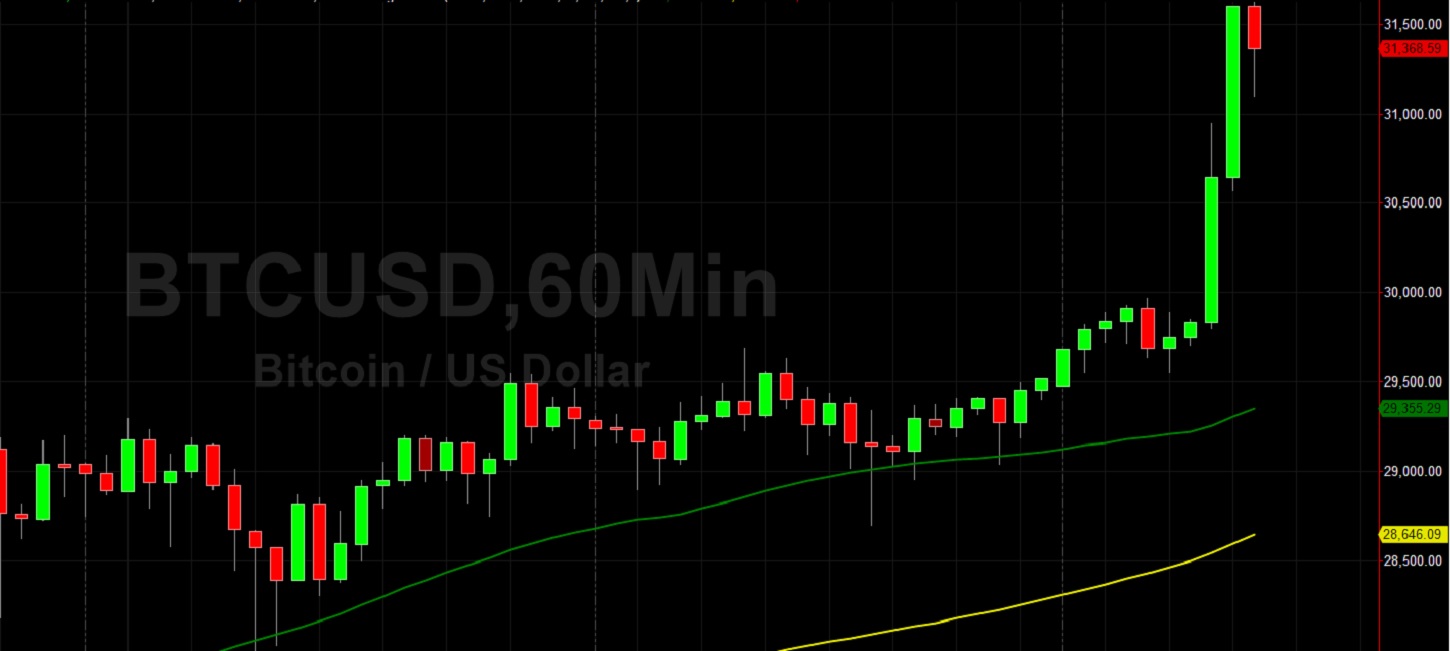
Price activity is nearest the 50-bar MA (4-hourly) at 27493.29 and the 50-bar MA (Hourly) at 29353.13.
Technical Support is expected around 30242.29/ 29388.13/ 28697.78 with Stops expected below.
Technical Resistance is expected around 31694.55/ 34446.27/ 35300 with Stops expected above.
On 4-Hourly chart, SlowK is Bullishly above SlowD while MACD is Bullishly above MACDAverage.
On 60-minute chart, SlowK is Bullishly above SlowD while MACD is Bullishly above MACDAverage.