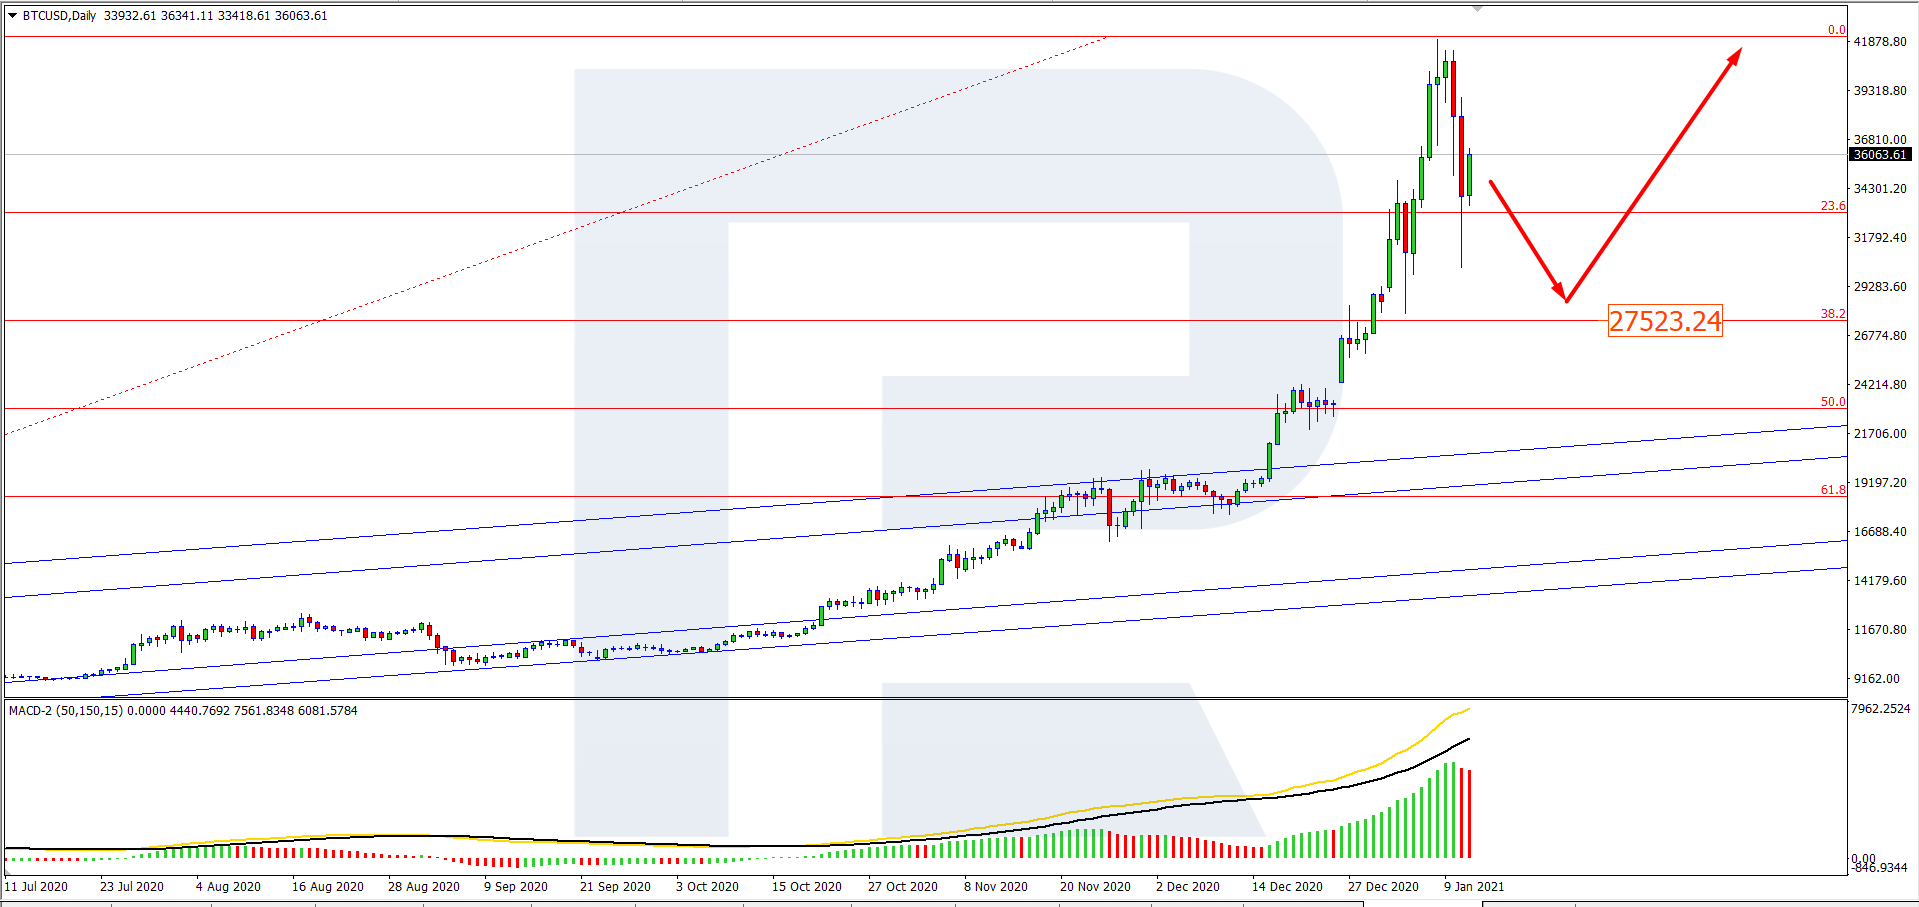
On D1, the tech picture has changed dramatically since a couple of days ago: the pair is developing a correction after sky-rocketing. The aim of the pullback might be 38.2% Fibo. The MACD histogram is positive and keeps declining, increasing the chances for further correction. The signal lines of the indicator are also demonstrating an uptrend, which might enhance the correction before growth if a Black Cross forms.
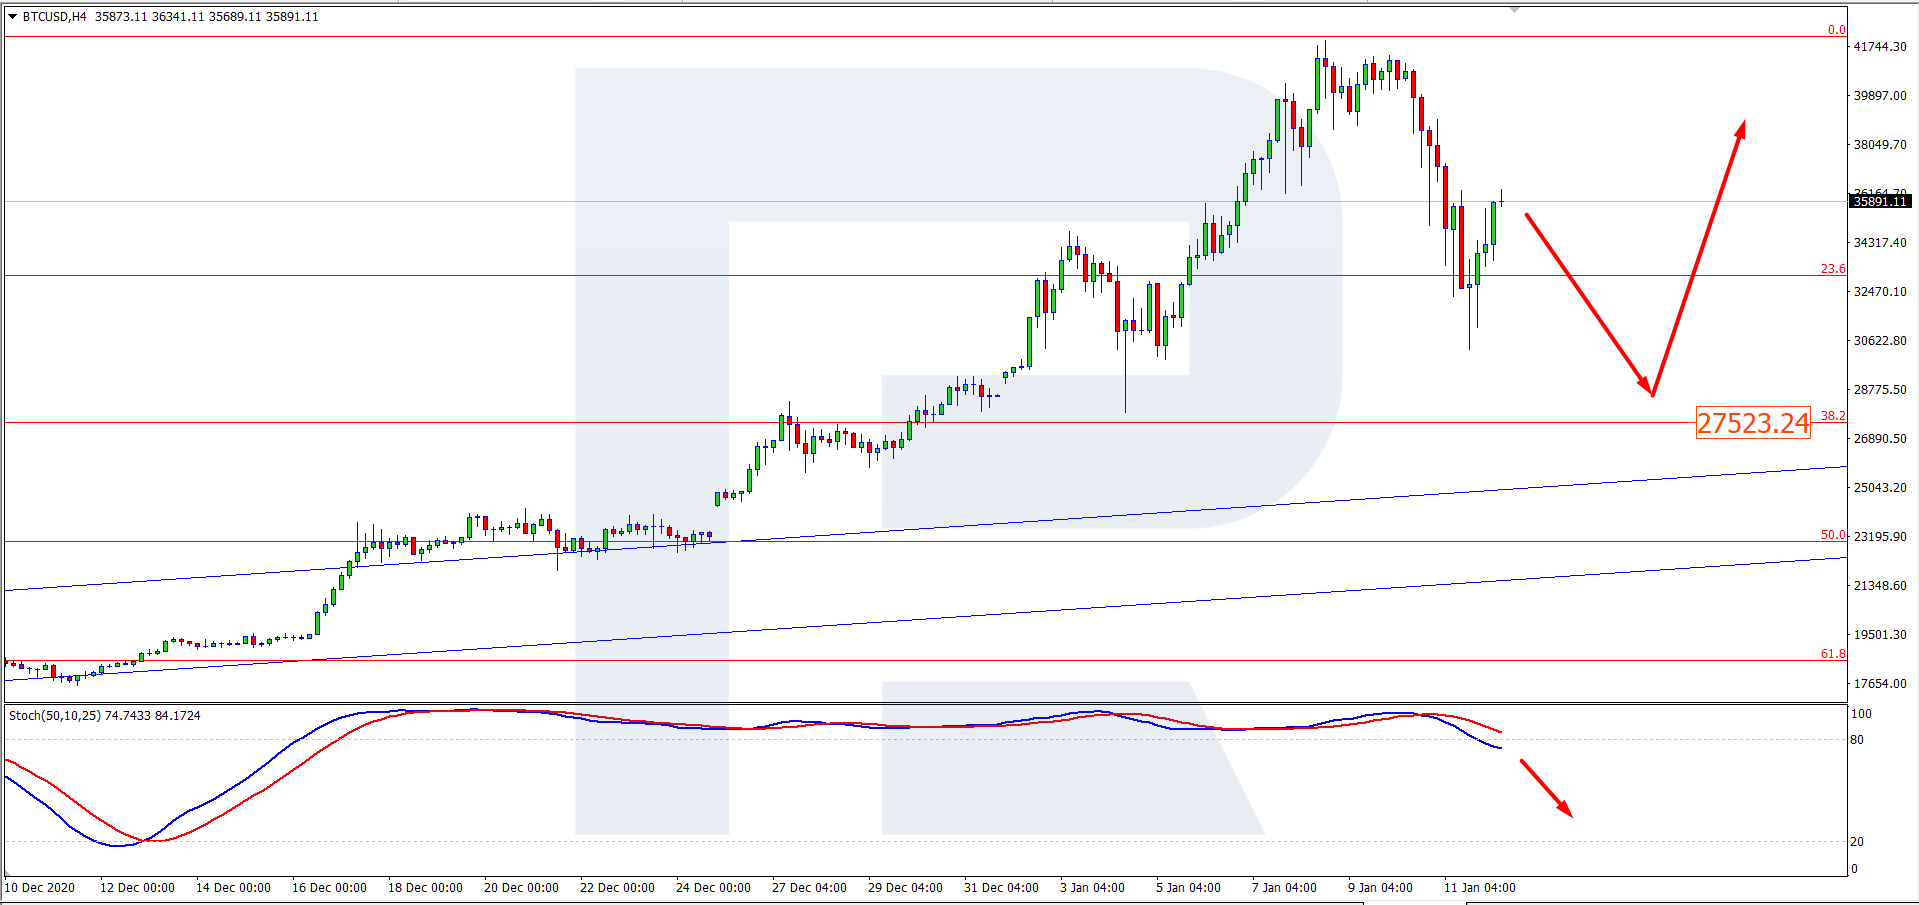
On H4, the correction of BTC/USD also looks quite probable. The Stochastic keeps going in the overbought area, which is an additional signal for the pullback. The aim of the decline might become the support near 27,523 USD. As for the growth when it resumes, it should aim at the same point of 41,900 USD as on larger timeframes.
In the Bank of America, they say that the BTC is the worst of bubbles possible, and its growth is nothing else but the result of a speculative mania. It took the BTC price 3 full months to grow by 250%, which is an indeed amazing result. However, common traits with preceding bubbles are clearly visible. The Rosenberg Research experts have already warned of similar risk.
If previously users kept counting their profits, watching the BTC grow, we are witnessing losses forming now. Due to the decline of the flagship cryptocurrency, more than 260 thousand investors had to close their positions. In certain cases, losses were over 10 million USD.
The BTC volatility in January brought to surface the discussion of the crypto future. For example, in J.P.Morgan they predict the growth of the Bitcoin to 146 thousand USD per coin and its victory over gold in the arena of protective assets.
However, you should see the difference between the traditional protective gold – and the BTC, supported by nothing but market trust and reputation.
By Dmitriy Gurkovskiy, Chief Analyst at RoboForex

On D1, the tech picture has changed dramatically since a couple of days ago: the pair is developing a correction after sky-rocketing. The aim of the pullback might be 38.2% Fibo. The MACD histogram is positive and keeps declining, increasing the chances for further correction. The signal lines of the indicator are also demonstrating an uptrend, which might enhance the correction before growth if a Black Cross forms.
On H4, the correction of BTC/USD also looks quite probable. The Stochastic keeps going in the overbought area, which is an additional signal for the pullback. The aim of the decline might become the support near 27,523 USD. As for the growth when it resumes, it should aim at the same point of 41,900 USD as on larger timeframes.
In the Bank of America, they say that the BTC is the worst of bubbles possible, and its growth is nothing else but the result of a speculative mania. It took the BTC price 3 full months to grow by 250%, which is an indeed amazing result. However, common traits with preceding bubbles are clearly visible. The Rosenberg Research experts have already warned of similar risk.
If previously users kept counting their profits, watching the BTC grow, we are witnessing losses forming now. Due to the decline of the flagship cryptocurrency, more than 260 thousand investors had to close their positions. In certain cases, losses were over 10 million USD.
The BTC volatility in January brought to surface the discussion of the crypto future. For example, in J.P.Morgan they predict the growth of the Bitcoin to 146 thousand USD per coin and its victory over gold in the arena of protective assets.
However, you should see the difference between the traditional protective gold – and the BTC, supported by nothing but market trust and reputation.
By Dmitriy Gurkovskiy, Chief Analyst at RoboForex