Ethereum (ETH/USD) looked to add to recent price gains as traders continue to eye the psychologically-important 650 level following the pair’s ongoing appreciation. Notably, ETH/USD has appreciated approximately 77% since the beginning of October, and has appreciated approximately 64% since the beginning of November. The pair last week traded around its recently-established multi-year high around at the 636.53 level, an area that was reached after Stops were elected above another recent relative multi-year high around the 623.22 area. This recent multi-year high also represented a test of the 637.79 level, an upside price objective related to buying pressure that emerged earlier this year around the 135.12 area. Additional upside price objectives include the 668.87, 679.78, and 698.88 areas, levels that relate to buying pressure that emerged earlier this year around the 125.52, 122.15, and 116.25 areas.
Following the move to a recent multi-year high, traders are paying close attention to recent areas of upside buying pressure, including the 370.50, 423.00, 439.77, and 480.08 areas. Some important retracement levels related to these ranges include 561.37, 534.91, 514.93, 503.52, and 472.12. Below current price activity, additional areas of technical support include the 507.55, 474.77, 406.48, and 395.87 levels. Traders are observing that the 50-bar MA (4-hourly) is bullishly indicating above the 100-bar MA (4-hourly) and above the 200-bar MA (4-hourly). Also, the 50-bar MA (hourly) is bullishly indicating below the 100-bar MA (hourly) and above the 200-bar MA (hourly).
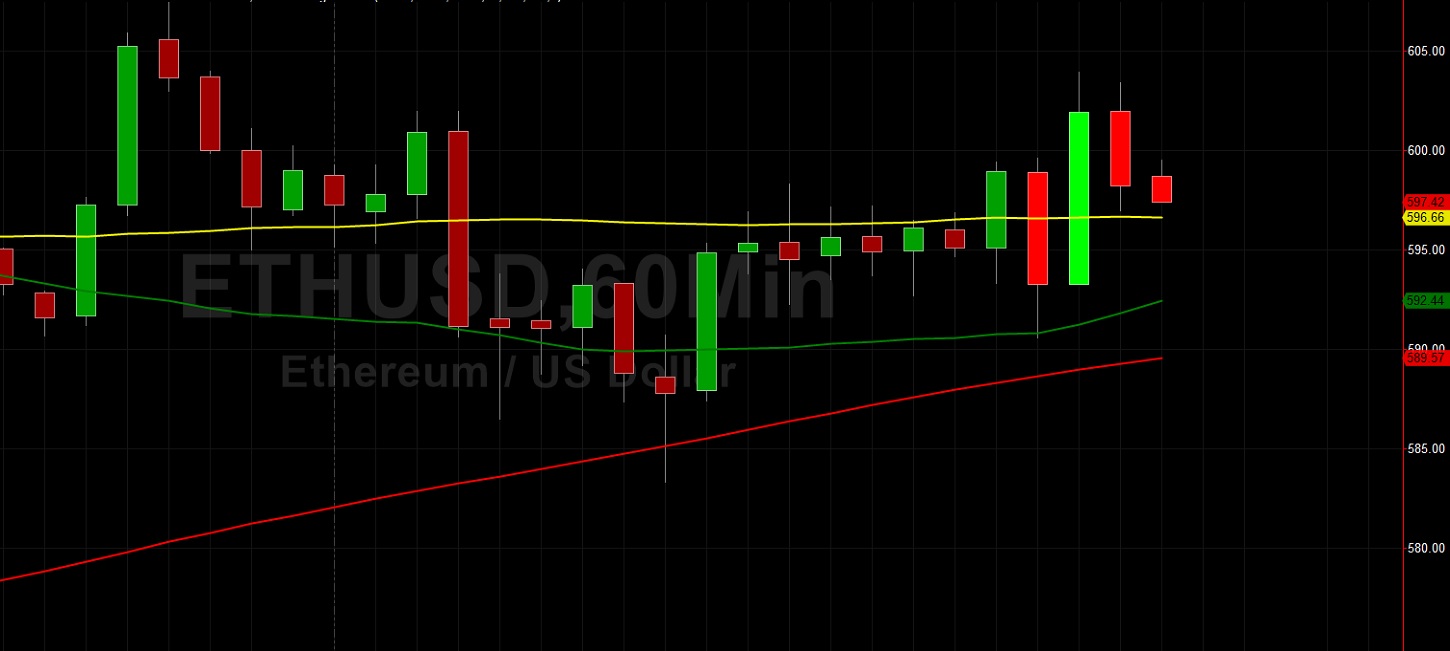
Price activity is nearest the 50-bar MA (4-hourly) at 590.34 and the 100-bar MA (Hourly) at 596.67.
Technical Support is expected around 417.60/ 388.49/ 366.72 with Stops expected below.
Technical Resistance is expected around 637.79/ 668.87/ 679.78 with Stops expected above.
On 4-Hourly chart, SlowK is Bullishly above SlowD while MACD is Bearishly below MACDAverage.
On 60-minute chart, SlowK is Bearishly below SlowD while MACD is Bullishly above MACDAverage.