Ethereum (ETH/USD) gained slight ground early in today’s North American session as the pair moved higher to the 582.90 area after trading as low as the 575.58 area in the European session. The pair peaked around the 591.71 area in the Asian session, representing a test of the 76.4% retracement of the recent depreciating range from 595.21 to 581.51. Notably, the pair found technical support just below the 576.77 area during the European and North American sessions, a level that represents the 38.2% retracement of the appreciating range from 480.08 to 636.53. Notably, these intraday lows were also just below the 50-hour simple moving average. Stops were recently elected above the 583.43 area during the appreciation, representing the 50% retracement of the depreciating range from 636.53 to 530.32. This recent multi-year high around the 636.53 area represented a test of the 637.79 level, an upside price objective related to buying pressure that emerged earlier this year around the 135.12 area.
One key range that traders continue to watch is the recent appreciation from 480.08 to 636.53. Below recent price activity, potential areas of technical support include the 517.00, 513.56, 474.77, 460.77, 427.76, and 406.48 levels. Above current price activity, additional upside price objectives include the 668.87, 679.78, and 698.88 areas, levels that relate to buying pressure that emerged earlier this year around the 125.52, 122.15, and 116.25 areas. Traders are observing that the 50-bar MA (4-hourly) is bearishly indicating below the 100-bar MA (4-hourly) and above the 200-bar MA (4-hourly). Also, the 50-bar MA (hourly) is bullishly indicating above the 100-bar MA (hourly) and above the 200-bar MA (hourly).
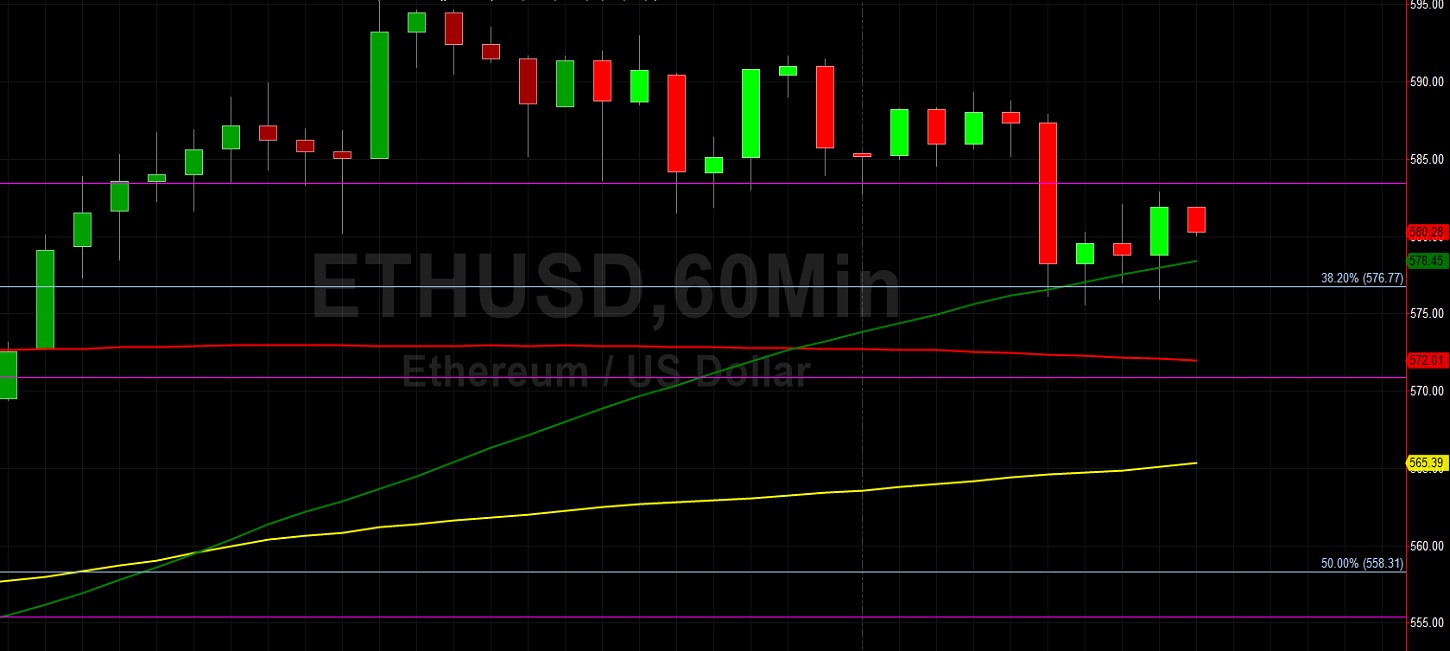
Price activity is nearest the 100-bar MA (4-hourly) at 577.39 and the 50-bar MA (Hourly) at 578.45.
Technical Support is expected around 417.60/ 388.49/ 366.72 with Stops expected below.
Technical Resistance is expected around 637.79/ 668.87/ 679.78 with Stops expected above.
On 4-Hourly chart, SlowK is Bearishly below SlowD while MACD is Bullishly above MACDAverage.
On 60-minute chart, SlowK is Bullishly above SlowD while MACD is Bearishly below MACDAverage.