Ethereum (ETH/USD) weakened early in today’s North American session as the pair declined to the 631.02 area after trading as high as the 664.46 area during the European session, with the intraday high representing a test of the 76.4% retracement of the recent depreciating range from 677.05 to 626.79. Also, the intraday low was a test of the 630.57 area, representing the 23.6% retracement of the recent appreciating range from 480.08 to 677.05. Stops were elected above the 627.83, 638.28, and 652.36 areas during ETH/USD’s escalation to fresh multi-year highs this week. Another additional upside target is the 702.42 level, an area that represents the 76.4% retracement of the depreciating range from 894.50 to 80.60. The pair this week found technical support just below the 576.77 area, a level that represents the 38.2% retracement of the appreciating range from 480.08 to 636.53.
Stops were recently elected above the 583.43 area during the appreciation, representing the 50% retracement of the depreciating range from 636.53 to 530.32. The previous multi-year high around the 636.53 area represented a test of the 637.79 level, an upside price objective related to buying pressure that emerged earlier this year around the 135.12 area. One key range that traders continue to watch is the recent appreciation from 480.08 to 670.00. Below recent price activity, potential areas of technical support include the 625.18, 615.67, 611.71, 599.32, 597.45, and 575.65 levels. Traders are observing that the 50-bar MA (4-hourly) is bullishly indicating above the 100-bar MA (4-hourly) and above the 200-bar MA (4-hourly). Also, the 50-bar MA (hourly) is bullishly indicating above the 100-bar MA (hourly) and above the 200-bar MA (hourly).
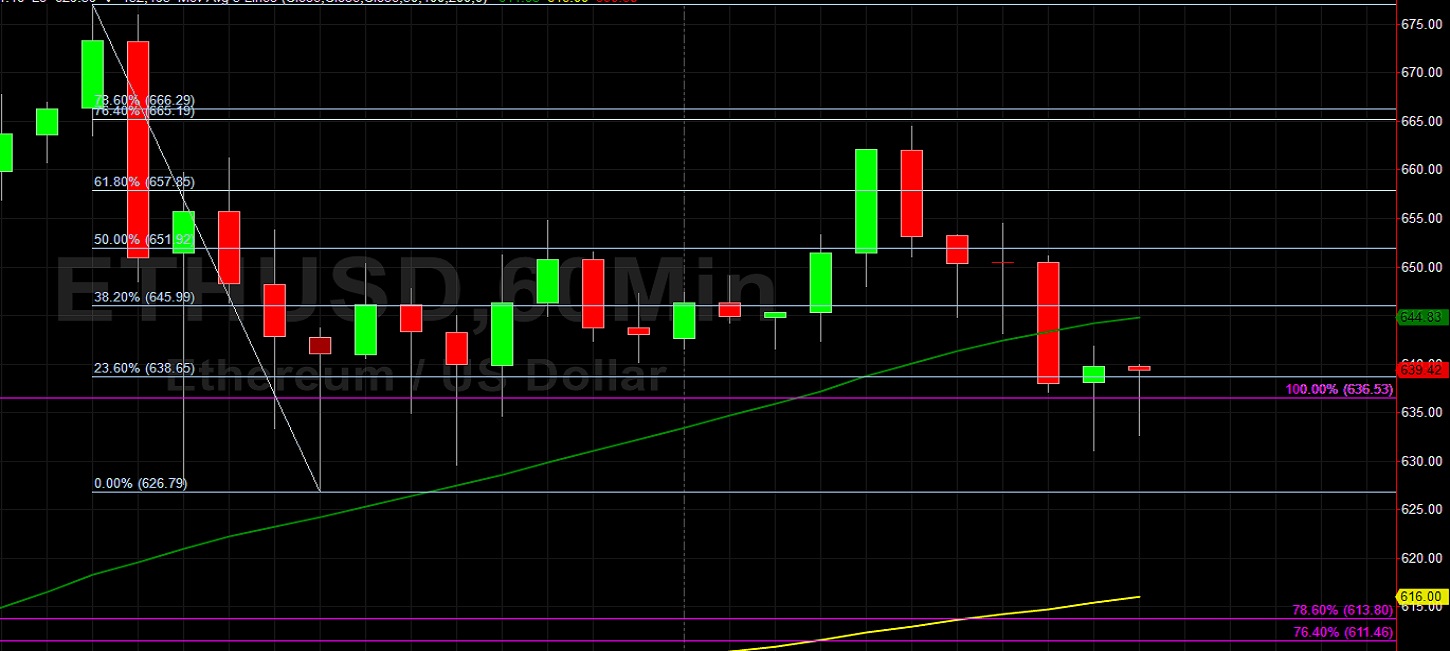
Price activity is nearest the 50-bar MA (4-hourly) at 591.28 and the 50-bar MA (Hourly) at 644.83.
Technical Support is expected around 417.60/ 388.49/ 366.72 with Stops expected below.
Technical Resistance is expected around 679.78/ 702.42/ 750.28 with Stops expected above.
On 4-Hourly chart, SlowK is Bearishly below SlowD while MACD is Bearishly below MACDAverage.
On 60-minute chart, SlowK is Bearishly below SlowD while MACD is Bearishly below MACDAverage.