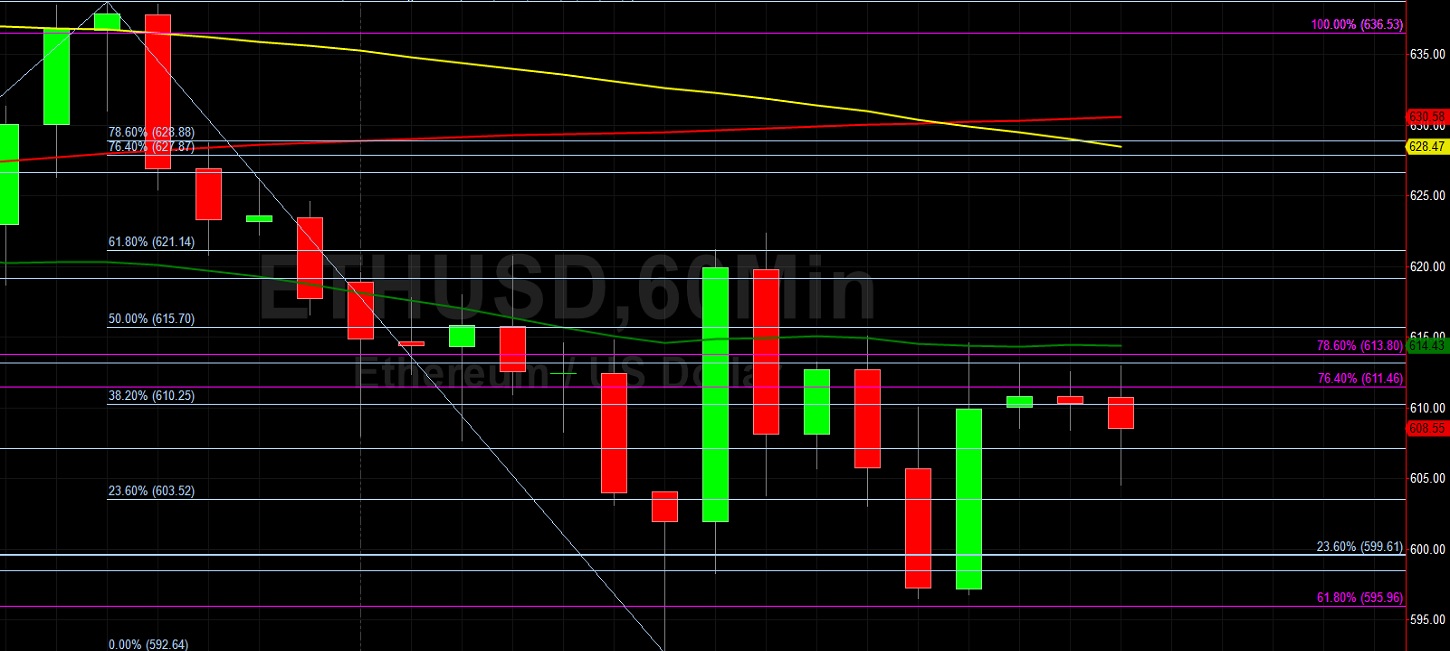
Ethereum (ETH/USD) was given early in today’s North American session as the pair depreciated to the 592.64 area after trading as high as the 638.75 area during the Asian session, right around the 61.8% retracement of a historical depreciating range from 982.99 to 80.60. During a retracement higher to the 622.35 level during the North American session, ETH/USD encountered technical resistance around the 61.8% retracement of the depreciating range from 638.75 to 592.64. Chartists also note ETH/USD ran into selling pressure around the 50-hour simple moving average. Some additional areas of potential technical support that traders are carefully observing include the 580.00, 559.95, 550.03, 530.41, and 523.78 areas. Stops were recently elected above the 627.83, 638.28, and 652.36 areas during ETH/USD’s escalation to fresh multi-year highs. One additional upside target is the 702.42 level, an area that represents the 76.4% retracement of the depreciating range from 894.50 to 80.60.
The pair this past week found technical support just below the 576.77 area, a level that represents the 38.2% retracement of the appreciating range from 480.08 to 636.53. Stops were recently elected above the 583.43 area during the appreciation, representing the 50% retracement of the depreciating range from 636.53 to 530.32. The previous multi-year high around the 636.53 area represented a test of the 637.79 level, an upside price objective related to buying pressure that emerged earlier this year around the 135.12 area. Traders are observing that the 50-bar MA (4-hourly) is bullishly indicating above the 100-bar MA (4-hourly) and above the 200-bar MA (4-hourly). Also, the 50-bar MA (hourly) is bearishly indicating below the 100-bar MA (hourly) and below the 200-bar MA (hourly).
Price activity is nearest the 100-bar MA (4-hourly) at 600.84 and the 50-bar MA (Hourly) at 614.37.
Technical Support is expected around 417.60/ 388.49/ 366.72 with Stops expected below.
Technical Resistance is expected around 679.78/ 702.42/ 750.28 with Stops expected above.
On 4-Hourly chart, SlowK is Bearishly below SlowD while MACD is Bearishly below MACDAverage.
On 60-minute chart, SlowK is Bearishly below SlowD while MACD is Bearishly below MACDAverage.