Ethereum (ETH/USD) was given early in today’s North American session as the pair depreciated to the 592.64 area after trading as high as the 638.75 area during the Asian session, right around the 61.8% retracement of a historical depreciating range from 982.99 to 80.60. Traders have recently taken ETH/USD back below the psychologically-important 600 figure but technical bids have kept the pair’s downside limited. Traders are curious to see how ETH/USD trades through the holiday period and finishes the calendar year. ETH/USD has recently traded down more than 4% month-to-date, and has traded up more than 425% year-to-date.
The pair’s recently-established multi-year high around the 677.05 area has traders focusing on some key retracement levels including the 591.13, 586.41, 568.04, 558.90, 538.51, 523.78, and 504.57 levels. If ETH/USD resumes recent upward buying pressure, one additional upside price objective includes the 702.42 level. Other levels that are technically significant include a range of upside price objectives above which Stops were elected during the recent appreciation, and these include the 627.83, 638.28, and 652.36 areas. Traders are observing that the 50-bar MA (4-hourly) is bullishly indicating above the 100-bar MA (4-hourly) and above the 200-bar MA (4-hourly). Also, the 50-bar MA (hourly) is bearishly indicating below the 100-bar MA (hourly) and below the 200-bar MA (hourly).
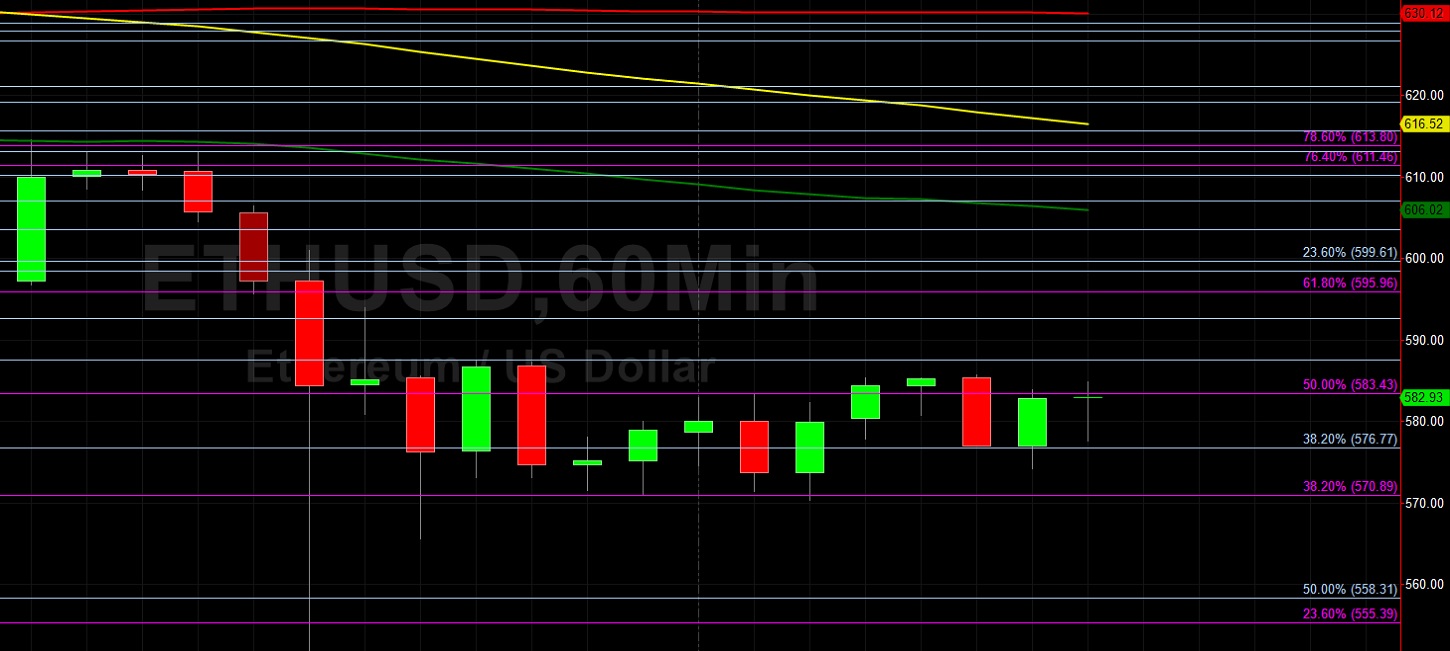
Price activity is nearest the 200-bar MA (4-hourly) at 587.00 and the 50-bar MA (Hourly) at 606.00.
Technical Support is expected around 417.60/ 388.49/ 366.72 with Stops expected below.
Technical Resistance is expected around 679.78/ 702.42/ 750.28 with Stops expected above.
On 4-Hourly chart, SlowK is Bullishly above SlowD while MACD is Bearishly below MACDAverage.
On 60-minute chart, SlowK is Bullishly above SlowD while MACD is Bullishly above MACDAverage.