Ethereum (ETH/USD) came off slightly early in today’s North American session as the pair moved lower to the 721.30 area after trading as high as the 738.90 area during the European session, one day after establishing a new multi-year high around the 747.00 area. Chartists note that this fresh multi-year high represented a test of an upside price objective around the 745.94 area. Traders earlier had taken ETH/USD as high as the 739.66 area during the Asian session before knocking it lower to the 688.00 area, a pullback that occurred before the pair was bid higher from the 50-hour simple moving average. Significant Stops were recently elected above the 615.19, 637.79, 668.87, 679.78, and 698.88 area during the march to successive multi-year highs. Additional upside price objectives include the 819.23, 879.23, 910.42, 939.22, and 985.15 areas.
Following the pair’s recent moves to successive all-time highs, downside retracement levels and areas of potential technical support include the 710.09, 694.34, 672.97, 656.62, 628.40, and 601.94 levels. ETH/USD has recently traded up more than 5% month-to-date, and traded up more than 450% year-to-date. Traders are observing that the 50-bar MA (4-hourly) is bullishly indicating above the 100-bar MA (4-hourly) and above the 200-bar MA (4-hourly). Also, the 50-bar MA (hourly) is bullishly indicating above the 100-bar MA (hourly) and above the 200-bar MA (hourly).
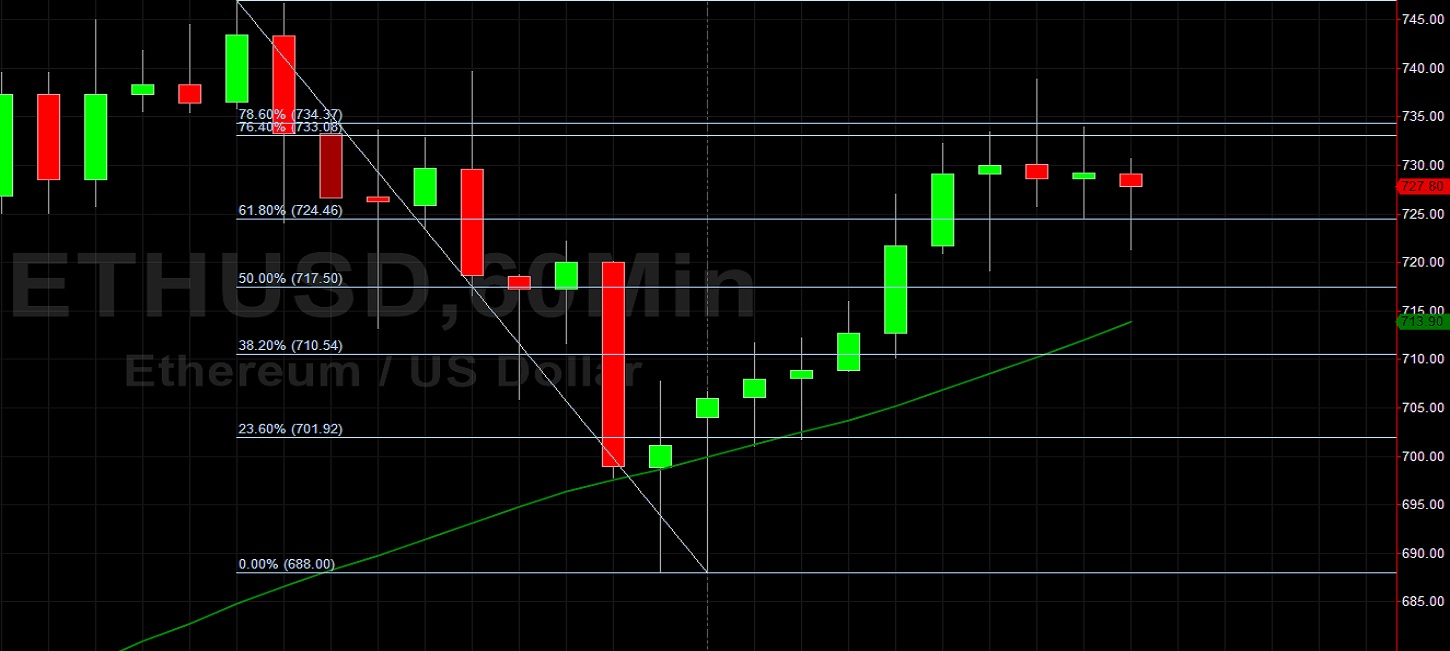
Price activity is nearest the 50-bar MA (4-hourly) at 641.57 and the 50-bar MA (Hourly) at 713.88.
Technical Support is expected around 699.32/ 612.33/ 530.32 with Stops expected below.
Technical Resistance is expected around 747.00/ 819.23/ 877.71 with Stops expected above.
On 4-Hourly chart, SlowK is Bullishly above SlowD while MACD is Bullishly above MACDAverage.
On 60-minute chart, SlowK is Bullishly above SlowD while MACD is Bullishly above MACDAverage.