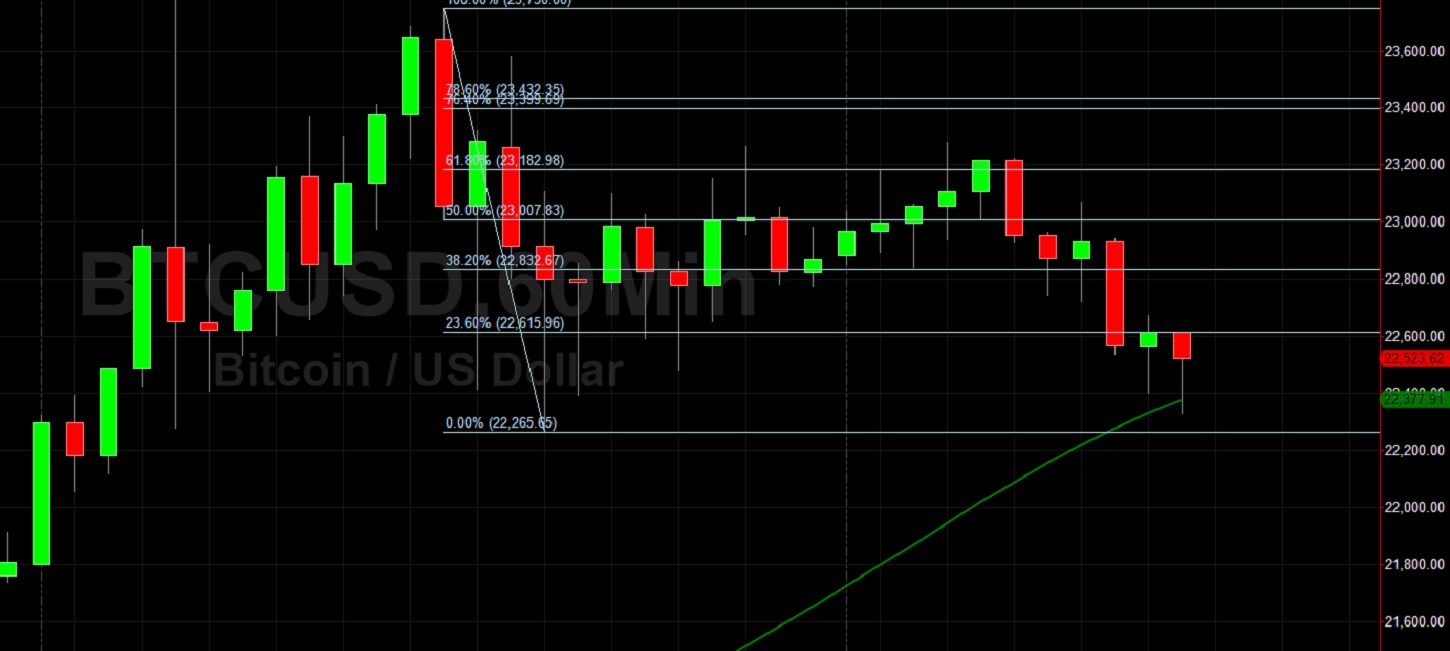
Bitcoin (BTC/USD) extended its pullback early in today’s North American session as the pair depreciated to the 22329.00 area after trading as high as the 23285.00 area during the European session. Notably, BTC/USD reached a fresh all-time high around the 23776.94 area this week, representing a test of the 23779.58 area. This level is an important upside price objective related to upside pressure that emerged around the 13215.00 area during the pair’s recent rebound higher. Chartists are noting that BTC/USD has tested the 50-hour simple moving average, and that BTC/USD remained below the 76.4% retracement of the recent depreciating range from 23750 to 22265.65. During the pair’s acute appreciation over the past several days, Stops were elected above a series of important upside price objectives including the 20534.46 and 21909.24 areas, levels that became important following buying activity around the 6854.67 and 6430 areas earlier this year. Additional Stops were triggered above many levels, including the 21099.20, 21161.36, 21218.14, 22120.21, 22318.47, and 23185.14 areas. There are many additional upside price objectives including the 24374.73, 24758.05, 24862.28, 25171.61, and 25373.10 areas.
Chartists are observing that buying pressure emerged around the 22656.88 area during a pullback today, right around the 23.6% retracement of the recent appreciating range from 19051.27 to 23776.94. Additional areas of potential technical support include the 22314.46, 21971.73, 21409.71, 20856.48, 20678.47, 20166.53, and 19947.23 levels. Below recent price activity, potential areas of technical support include the 19424.08, 19308.02, 18978.04, 18808.96, 18719.62, 18620.11, and 18310.00 areas. Traders are observing that the 50-bar MA (4-hourly) is bullishly indicating above the 100-bar MA (4-hourly) and above the 200-bar MA (4-hourly). Also, the 50-bar MA (hourly) is bullishly indicating above the 200-bar MA (hourly) and above the 100-bar MA (hourly).
Price activity is nearest the 50-bar MA (4-hourly) at 19767.31 and the 50-bar MA (Hourly) at 22378.19.
Technical Support is expected around 21971.13/ 21409.71/ 20678.47 with Stops expected below.
Technical Resistance is expected around 24374.73/ 24758.05/ 25171.61 with Stops expected above.
On 4-Hourly chart, SlowK is Bearishly below SlowD while MACD is Bullishly above MACDAverage.
On 60-minute chart, SlowK is Bearishly below SlowD while MACD is Bearishly below MACDAverage.