Bitcoin (BTC/USD) extended its recent recovery early in today’s North American session after trading as low as the 17950.89 area during the Asian session. BTC/USD continues to evidence some weakness after peaking around the 19915.14 area in early December, a fresh multi-year high that saw the pair stop short of testing the psychologically-important 20000 figure after eclipsing the previous all-time high of 19891.99. Traders drove BTC/USD lower to test the 17580.00 level this past week, representing a test of the 61.8% retracement of the recent appreciating range from 16200 to 19915.14. During the pullback this past week, Stops were elected below the 18057.57 area, representing the 50% retracement of the appreciating range. Traders also observe that BTC/USD encountered technical support just above the 200-bar 4-hourly simple moving average multiple times this past week.
The pair has been mostly trading below the 200-hour simple moving average for several trading sessions. Below recent price activity, potential areas of technical support include the 17355.69, 17315.28, 17112.57, 17076.77, 16995.04, 16701.07, 16608.52, 16565.07, and 16451.16 levels. Above current price activity, additional upside price objectives include the 20311.36, 20534.46, and 21909.24 areas, levels that relate to buying pressure that emerged earlier this year around the 6430.00 and 6854.67 areas. Traders are observing that the 50-bar MA (4-hourly) is bullishly indicating above the 100-bar MA (4-hourly) and above the 200-bar MA (4-hourly). Also, the 50-bar MA (hourly) is bearishly indicating below the 100-bar MA (hourly) and below the 200-bar MA (hourly).
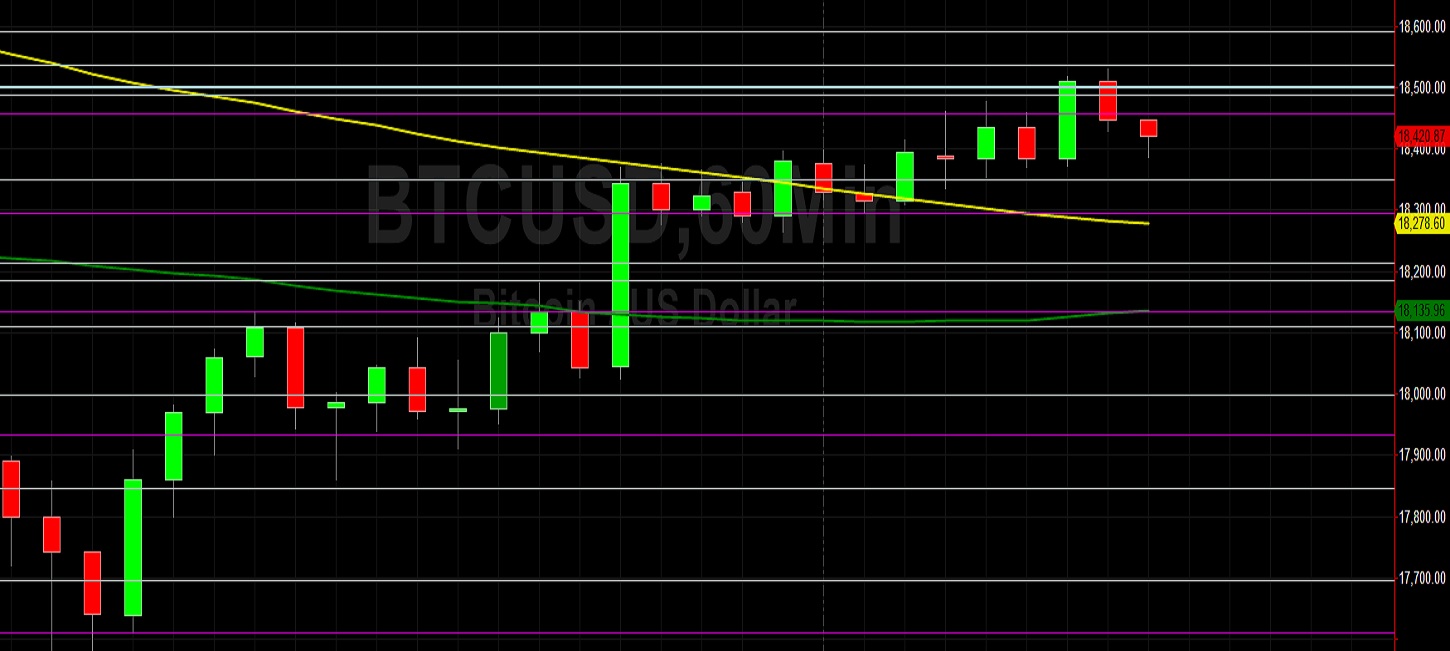
Price activity is nearest the 100-bar MA (4-hourly) at 18549.51 and the 100-bar MA (Hourly) at 18278.64.
Technical Support is expected around 16200/ 15996.17/ 15479.66 with Stops expected below.
Technical Resistance is expected around 19915.14/ 20311.36/ 21909.24 with Stops expected above.
On 4-Hourly chart, SlowK is Bullishly above SlowD while MACD is Bullishly above MACDAverage.
On 60-minute chart, SlowK is Bearishly below SlowD while MACD is Bullishly above MACDAverage.