Bitcoin (BTC/USD) lost some ground early in today’s North American session as the pair depreciated to the 27597.62 area after trading as high as the 28580 area during the Asian session, a fresh lifetime high. Traders pushed BTC/USD to the new lifetime high after Stops were elected above the previous lifetime high of 28387 established just days ago. Additional Stops were triggered above the 27079.78, 27388.28, and 27769.99 levels during the pair’s ascent, upside retracement levels related to the pair’s recent depreciating range from 28387 to 25772.55. Some bullish clues emerged after BTC/USD was supported above the 25667.32 area during recent pullbacks, a previous upside price objective related to buying pressure that emerged earlier this year around the 3858 area. Additional upside price objectives include the 29119.99, 30456.39, and 31424.78 areas.
Following the pair’s recent moves to successive all-time highs, downside retracement levels and areas of potential technical support include the 27006.79, 26033.53, 25984, 25658.32, 25542.26, 25246.92, and 25212.28 areas. BTC/USD has recently traded up more than 20% month-to-date, and traded up more than 230% year-to-date. Traders are observing that the 50-bar MA (4-hourly) is bullishly indicating above the 100-bar MA (4-hourly) and above the 200-bar MA (4-hourly). Also, the 50-bar MA (hourly) is bullishly indicating above the 100-bar MA (hourly) and above the 200-bar MA (hourly).
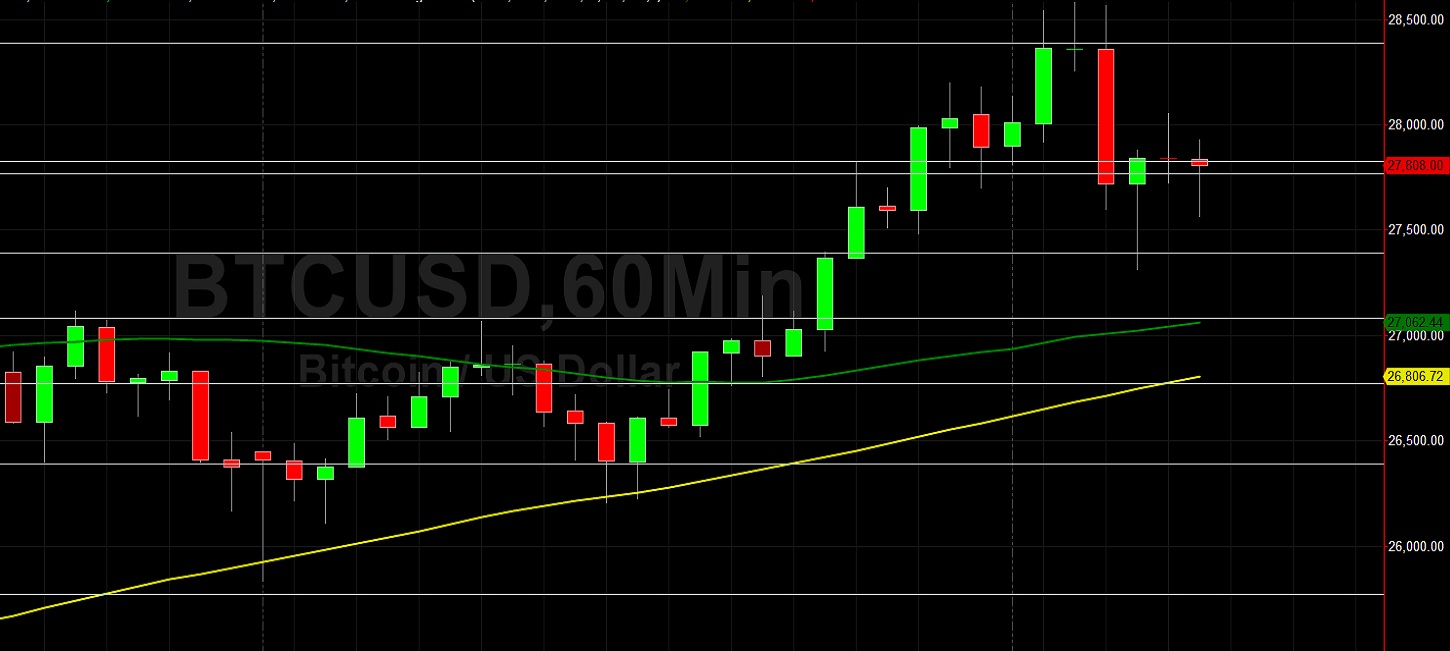
Price activity is nearest the 50-bar MA (4-hourly) at 25256.96 and the 50-bar MA (Hourly) at 27060.44.
Technical Support is expected around 25914.25/ 25510.87/ 24386.59 with Stops expected below.
Technical Resistance is expected around 29119.99/ 30456.39/ 31424.78 with Stops expected above.
On 4-Hourly chart, SlowK is Bearishly below SlowD while MACD is Bearishly below MACDAverage.
On 60-minute chart, SlowK is Bearishly below SlowD while MACD is Bearishly below MACDAverage.