Bitcoin (BTC/USD) extended gains early in today’s North American session as the pair appreciated to the 27065.88 area after trading as low as the 25833.73 area during the Asian session, a test of the 100-hour simple moving average. Traders pushed BTC/USD as high as the 27113.83 level during the Asian session, a test of the 50% retracement of the depreciating range from the recent lifetime high of 28387 to 25772.55. The next upside retracement levels in that depreciating range include 27388.28, 27769.99, and 27827.51. BTC/USD recently traded as low as the 25772.55 level during the Asian session, just above the 25667.32 area that represented an upside price objective related to buying pressure from the 3858 area earlier this year. BTC/USD established a new lifetime high around the 28387 area during the holiday weekend after significant Stops were elected above the 23158.16, 24090.75, 24179.17, 24862.28, 24919.02, 25247.15, and 25667.32 levels during the move higher. Additional upside price objectives include the 29119.99, 30456.39, and 31424.78 areas.
Following the pair’s recent moves to successive all-time highs, downside retracement levels and areas of potential technical support include the 25914.25, 25836.55, 25510.87, 25394.81, 25064.83, 25150.42, 25064.83, 24386.59, 24258.73, and 23731.57 levels. BTC/USD has recently traded up more than 18% month-to-date, and traded up more than 220% year-to-date. Chartists observe that BTC/USD has recently found technical support around the 50-hour simple moving average. Traders are observing that the 50-bar MA (4-hourly) is bullishly indicating above the 100-bar MA (4-hourly) and above the 200-bar MA (4-hourly). Also, the 50-bar MA (hourly) is bullishly indicating above the 100-bar MA (hourly) and above the 200-bar MA (hourly).
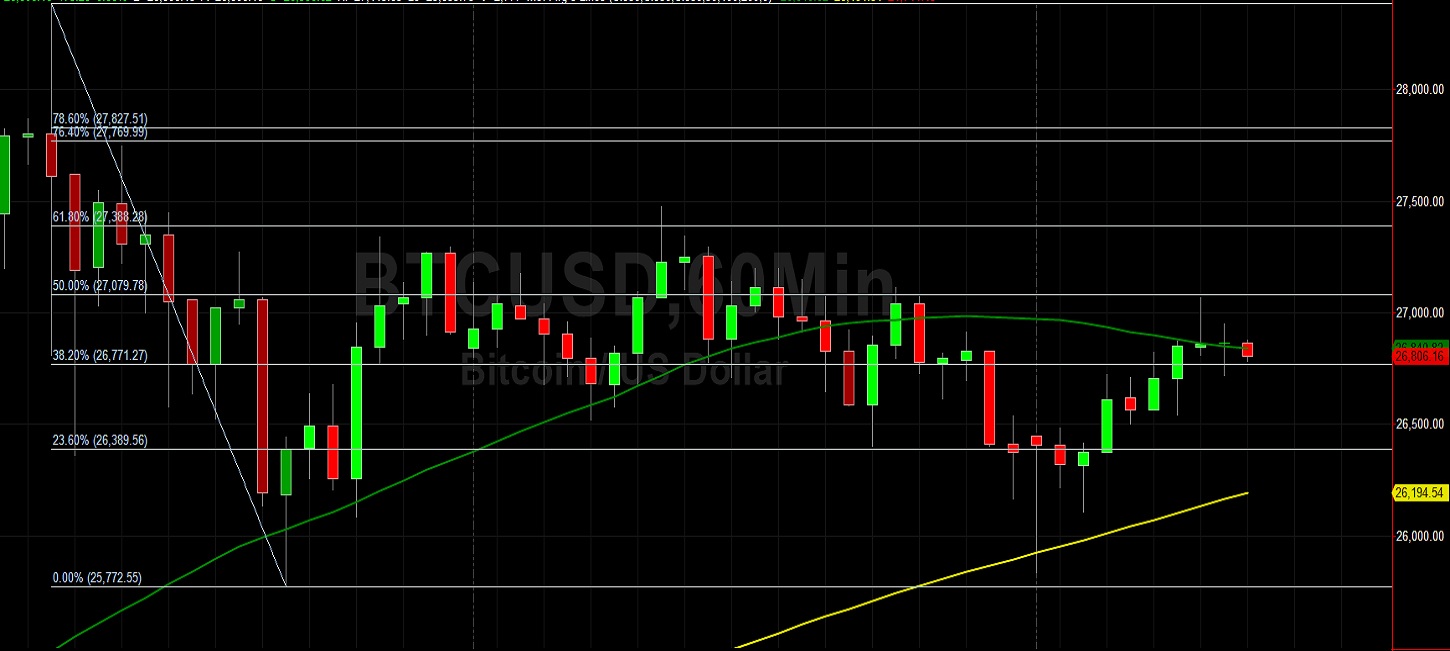
Price activity is nearest the 50-bar MA (4-hourly) at 24786.62 and the 50-bar MA (Hourly) at 26841.88.
Technical Support is expected around 25914.25/ 25510.87/ 24386.59 with Stops expected below.
Technical Resistance is expected around 29119.99/ 30456.39/ 31424.78 with Stops expected above.
On 4-Hourly chart, SlowK is Bullishly above SlowD while MACD is Bearishly below MACDAverage.
On 60-minute chart, SlowK is Bullishly above SlowD while MACD is Bullishly above MACDAverage.