Bitcoin (BTC/USD) reclaimed some lost ground early early in today’s North American session as the pair appreciated to the 19500.00 area trading as low as the 18109.00 area earlier in the Asian session, right around the 100-hour simple moving average. Traders observe that BTC/USD established a fresh all-time high at the 19915.14 area during the European session after Stops were elected above the previous all-time high of 19891.99. Traders are eyeing the 20311.36, 20534.46, and 21909.24 areas as upside price objectives. The pair stopped short of testing the 15808.49 area during the recent move lower, representing the 23.6% retracement of the wide appreciating range and absolute 2020 range from 3858 to 19500. Significant Stops were elected during the recent decline including below the 18605.14, 18275.16, 18016.74, 17604.12, 17517.42, 17156.69, 17099.13, 16905.00, 16603.10, 16357.50, and 16292.58 levels.
Traders will pay close attention to some potential areas of technical support during pullbacks lower and these include the 16092.69 and 15935.90 areas. Notably, the 15935.90 and 16304.69 areas represent the 76.4% and 78.6% retracements of a historical depreciation from 19891.99 to 3128.89. Further below current market activity, traders are paying close attention to additional potential areas of technical support during pullbacks and these include the 14273.50, 14259.01, 14101.50, 13989.55, 13892.29, 13705.50, 13663.43, and 13594.42 levels. Chartists are observing that the 50-bar MA (4-hourly) is bullishly indicating above the 100-bar MA (4-hourly) and above the 200-bar MA (4-hourly). Also, the 50-bar MA (hourly) is bullishly indicating above the 100-bar MA (hourly) and above the 200-bar MA (hourly).
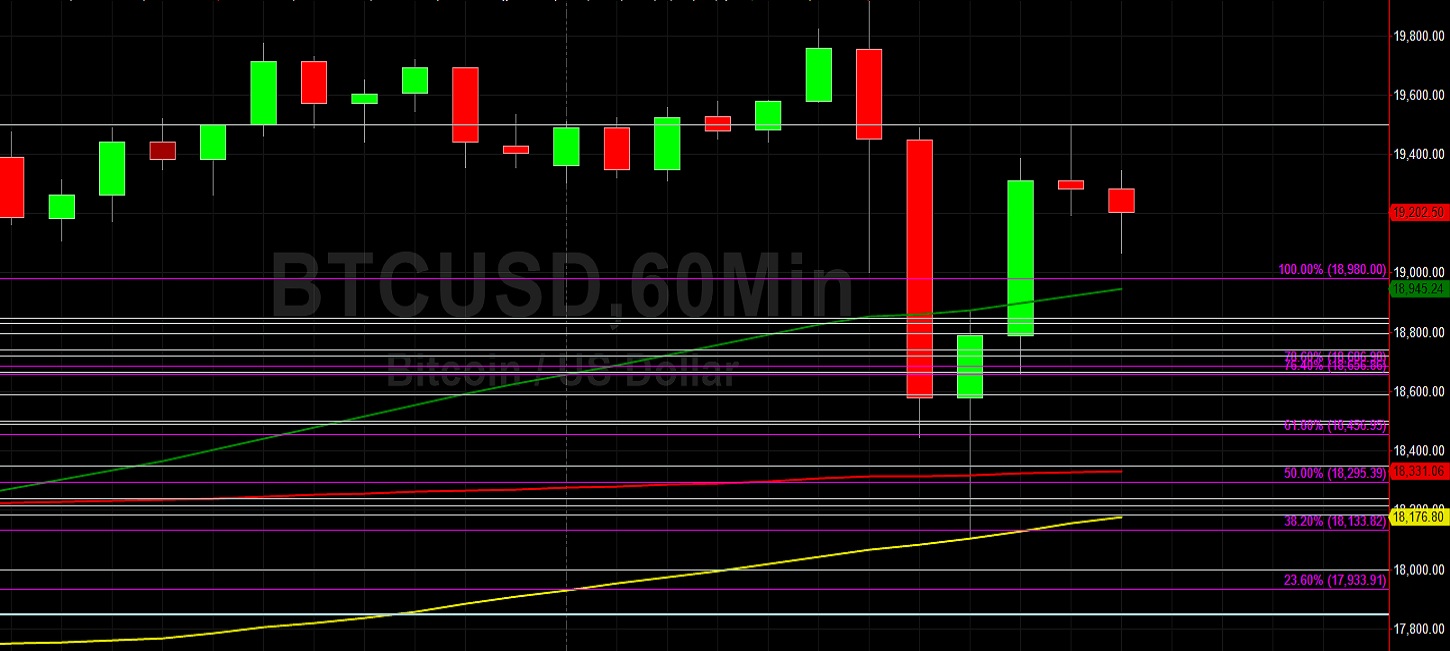
Price activity is nearest the 50-bar MA (4-hourly) at 18291.07 and the 50-bar MA (Hourly) at 18943.43.
Technical Support is expected around 16200/ 15996.17/ 15479.66 with Stops expected below.
Technical Resistance is expected around 19915.14/ 20311.36/ 21909.24 with Stops expected above.
On 4-Hourly chart, SlowK is Bearishly below SlowD while MACD is Bullishly above MACDAverage.
On 60-minute chart, SlowK is Bullishly above SlowD while MACD is Bearishly below MACDAverage.