Bitcoin (BTC/USD) marched higher early in today’s North American session as the pair appreciated to the 23628.34 level after trading as low as the 22380.05 area during the European session, a test of the 23.6% retracement of the appreciating range from 16200 to 24300. The pair has been mostly bid since encountering buying pressure right around the 21942.36 area, a level that represents the 23.6% retracement of the recent appreciating range from 14310 to 24300. Bids bullishly emerged around the 23106.92 area during BTC/USD’s climb higher, a level that represents the 50% retracement of the recent depreciating range from 24300 to 21913.84. Traders observe that BTC/USD established another lifetime high around the 24300 area early in the week. Additional upside price objectives including the 24374.73, 24758.05, 24862.28, 25171.61, and 25373.10 areas.
A couple of areas of potential technical support that traders are carefully observing include the 22984.90 and 22637.68 levels, and these are related to recent buying pressure around the 19051.27 and 17580 areas. Stops were elected above a series of upside price objectives during this latest upside extension to new lifetime highs, including the 23650.19, 23693.29, 23779.58, 24080.75, and 24179.17 levels. Below recent price activity, potential areas of technical support include the 19424.08, 19308.02, 18978.04, 18808.96, 18719.62, 18620.11, and 18310.00 areas. Traders are observing that the 50-bar MA (4-hourly) is bullishly indicating above the 100-bar MA (4-hourly) and above the 200-bar MA (4-hourly). Also, the 50-bar MA (hourly) is bearishly indicating below the 100-bar MA (hourly) and above the 200-bar MA (hourly).
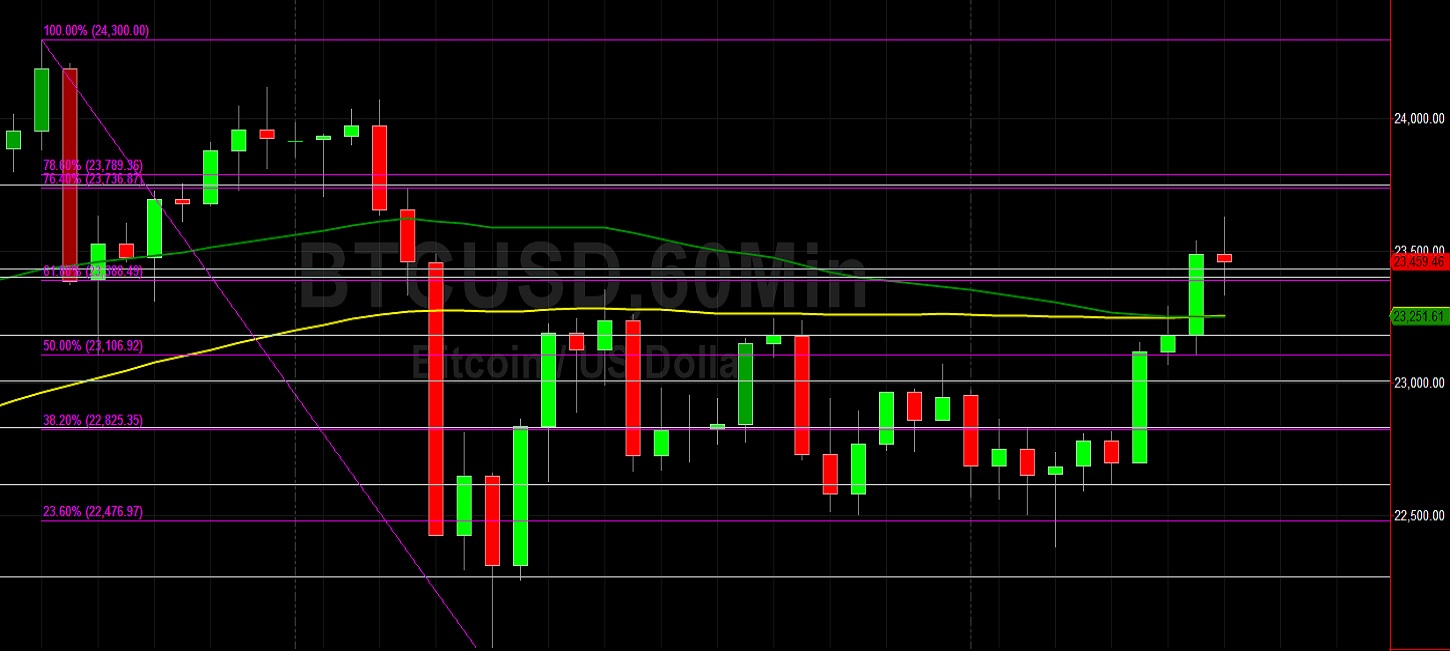
Price activity is nearest the 50-bar MA (4-hourly) at 22052.12 and the 100-bar MA (Hourly) at 23256.55.
Technical Support is expected around 21971.13/ 21409.71/ 20678.47 with Stops expected below.
Technical Resistance is expected around 24374.73/ 24758.05/ 25171.61 with Stops expected above.
On 4-Hourly chart, SlowK is Bullishly above SlowD while MACD is Bearishly below MACDAverage.
On 60-minute chart, SlowK is Bullishly above SlowD while MACD is Bullishly above MACDAverage.