Bitcoin (BTC/USD) exploded higher early in today’s North American session as the pair appreciated to the 24200 level after trading as low as the 22770.00 area during the European session, with the intraday high representing a fresh lifetime high. Stops were elected above the 23776.94 area during BTC/USD’s ascent, the previous lifetime high established this past week and an area right around a major upside price objective related to previous buying pressure around the 13215.00 area. Bids bullishly emerged around the 22314.46 area late this past week, right around the 23.6% retracement of the recent appreciating range from 17580 to 23776.94. Stops were elected above a series of upside price objectives during this latest upside extension to new lifetime highs, including the 23650.19, 23693.29, 23779.58, 24080.75, and 24179.17 levels. Additional upside price objectives including the 24374.73, 24758.05, 24862.28, 25171.61, and 25373.10 areas.
Chartists are observing that buying pressure emerged around the 22656.88 area during a recent pullback today, right around the 23.6% retracement of the recent appreciating range from 19051.27 to 23776.94. Additional areas of potential technical support include the 22314.46, 21971.73, 21409.71, 20856.48, 20678.47, 20166.53, and 19947.23 levels. Below recent price activity, potential areas of technical support include the 19424.08, 19308.02, 18978.04, 18808.96, 18719.62, 18620.11, and 18310.00 areas. Traders are observing that the 50-bar MA (4-hourly) is bullishly indicating above the 100-bar MA (4-hourly) and above the 200-bar MA (4-hourly). Also, the 50-bar MA (hourly) is bullishly indicating above the 200-bar MA (hourly) and above the 100-bar MA (hourly).
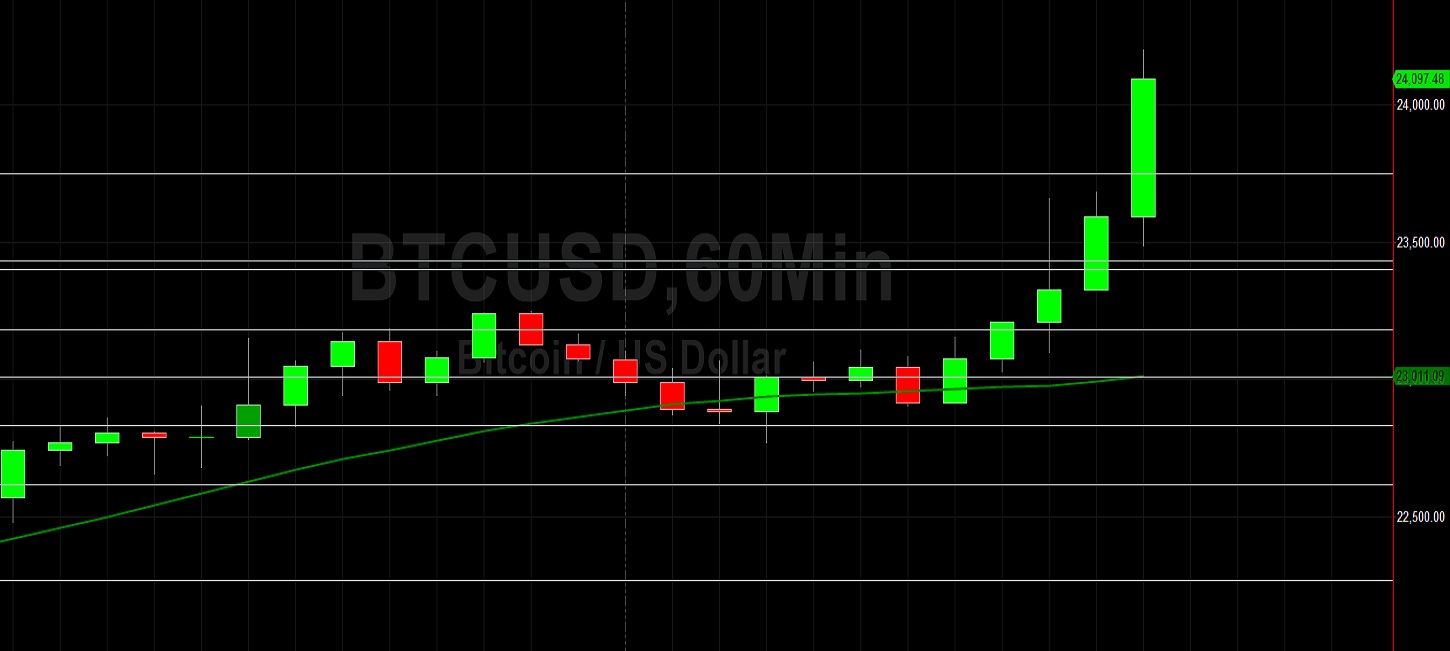
Price activity is nearest the 50-bar MA (4-hourly) at 20376.95 and the 50-bar MA (Hourly) at 23008.43.
Technical Support is expected around 21971.13/ 21409.71/ 20678.47 with Stops expected below.
Technical Resistance is expected around 24374.73/ 24758.05/ 25171.61 with Stops expected above.
On 4-Hourly chart, SlowK is Bullishly above SlowD while MACD is Bearishly below MACDAverage.
On 60-minute chart, SlowK is Bullishly above SlowD while MACD is Bullishly above MACDAverage.