19063 and 18930 Key BTC/USD Levels: Sally Ho's Technical Analysis 8 December 2020 BTC
Bitcoin (BTC/USD) extended its recent sideways trading activity as traders continue to eye the psychologically-important 20000 figure following the pair’s recent gains. Notably, BTC/USD has appreciated approximately 84% since the beginning of October, and has appreciated approximately 44% since the beginning of November. The pair has recently traded around its recently-established all-time high around the 19915.14 area, a level that was established after Stops were elected above the previous all-time high of 19891.99. Additional upside price objectives include the 20311.36, 20534.46, and 21909.24 areas, levels that relate to buying pressure that emerged earlier this year around the 6430.00 and 6854.67 areas.
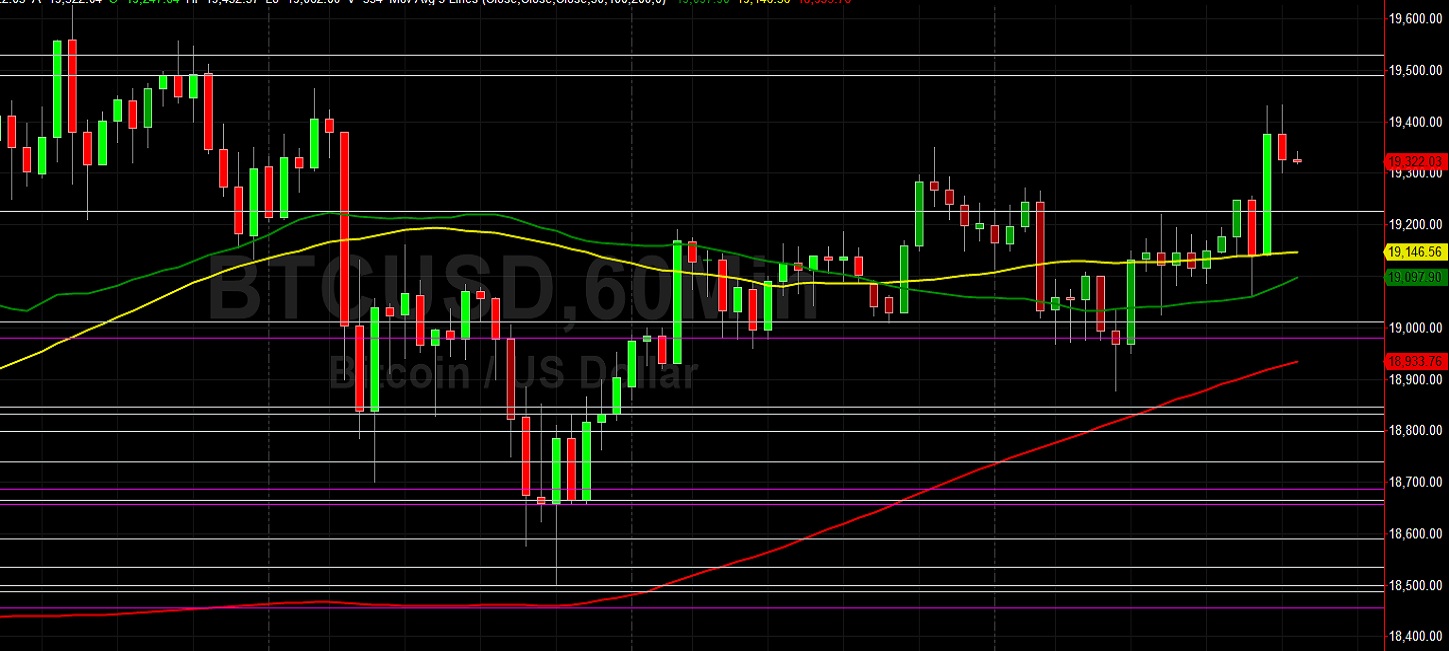
Following the move to a recent all-time high, traders are paying close attention to recent areas of upside buying pressure, including the 13215.00, 14310.00, 15708.24, 16200.00, and 17610.77 areas. Some important retracement levels related to these ranges include 18762.96, 18154.60, 17355.69, 17112.57, 16701.07, 16304.69, and 15935.90. Below current price activity, additional areas of technical support include the 14273.50, 14259.01, 14101.50, 13989.55, 13892.29, 13705.50, 13663.43, and 13594.42 levels. Chartists are observing that the 50-bar MA (4-hourly) is bullishly indicating above the 100-bar MA (4-hourly) and above the 200-bar MA (4-hourly). Also, the 50-bar MA (hourly) is bearishly indicating below the 100-bar MA (hourly) and above the 200-bar MA (hourly).
Price activity is nearest the 50-bar MA (4-hourly) at 18962.60 and the 100-bar MA (Hourly) at 19146.54.
Technical Support is expected around 16200/ 15996.17/ 15479.66 with Stops expected below.
Technical Resistance is expected around 19915.14/ 20311.36/ 21909.24 with Stops expected above.
On 4-Hourly chart, SlowK is Bullishly above SlowD while MACD is Bullishly above MACDAverage.
On 60-minute chart, SlowK is Bullishly above SlowD while MACD is Bullishly above MACDAverage.
