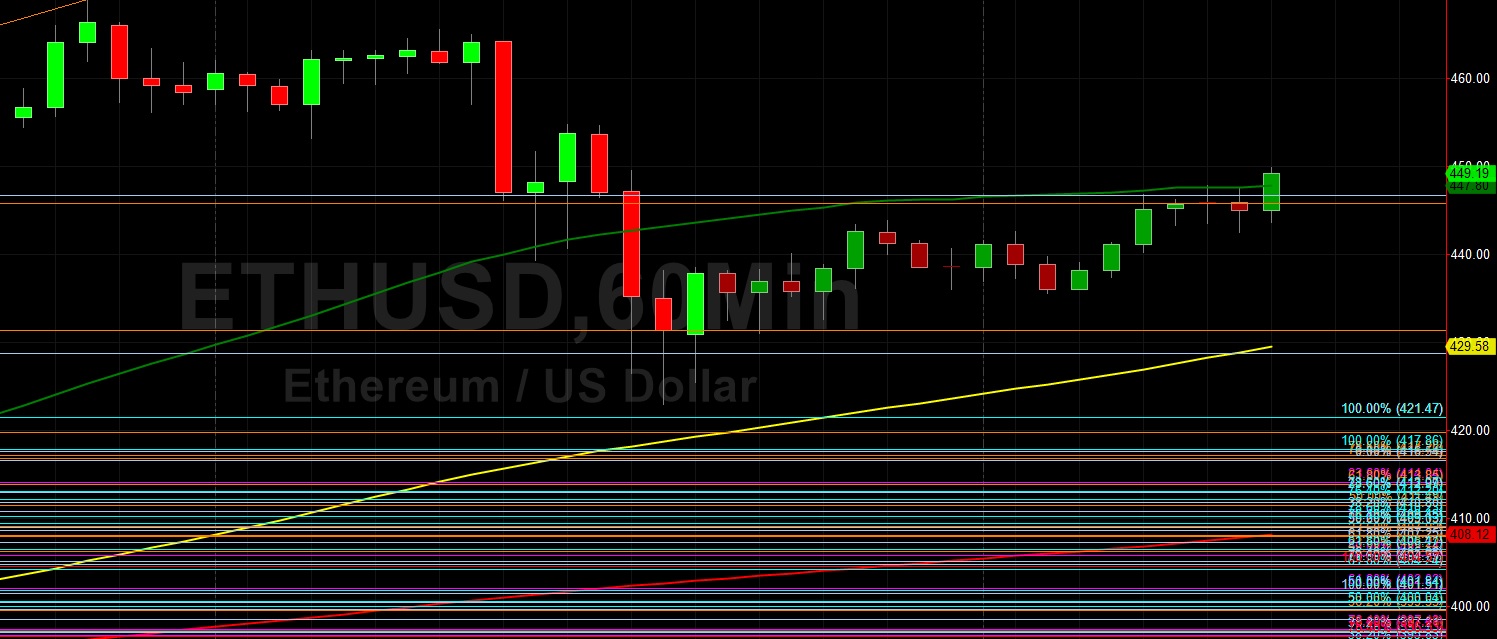
Ethereum (ETH/USD) regained ground early in today’s North American session as the pair appreciated to the 447.88 area after trading as low as the 423.00 area late in yesterday’s North American session. Stops were elected below the 445.74 and 431.36 areas during the pullback, levels that represents the 23.6% and 38.2% retracements of the appreciating range from 370.50 to 468.98. Technical support kept ETH/USD bid above the 421.47 area, a previous relative high, and the pair drifted higher back to test the 50-hour simple moving average right around the 446.71 area. After recently establishing fresh multi-month highs, ETH/USD came off and bears elected stops below retracement levels including 451.86, 447.19, 445.84, and 441.27. Additional downside retracement levels include 432.71, 431.36, 427.78, 424.14, 422.81, 419.74, 415.20, 411.91, and 408.12. Traders are observing that the 50-bar 4-hourly simple moving average has bullishly moved above the 100-bar 4-hourly simple moving average.
During the recent pullback lower, Stops were elected below the 404.79, 400.48, 396.99, 393.50, 389.19, and 388.54 areas, retracement areas related to the recent appreciating range from 382.21 to 411.77. Following ETH/USD’s run-up, traders are paying close attention to the 403.11, 395.14, 388.69, 382.84, and 374.27 levels as areas of potential technical support. Additional areas of potential upside pressure include the 400.56, 395.87, 387.62, 380.03, 377.17, 367.24, 366.72, 354.44, and 353.78 areas. The 396.69 area remains an important technical level, representing the 23.6% retracement of the historical depreciation from 1419.96 to 80.60, and traders are curious to see if ETH/USD can maintain this level. Traders are observing that the 50-bar MA (4-hourly) is bullishly indicating above the 100-bar MA (4-hourly) and above the 200-bar MA (4-hourly). Also, the 50-bar MA (hourly) is bullishly indicating above the 100-bar MA (hourly) and above the 200-bar MA (hourly).
Price activity is nearest the 50-bar MA (4-hourly) at 409.15 and the 50-bar MA (Hourly) at 447.78.
Technical Support is expected around 417.60/ 388.49/ 366.72 with Stops expected below.
Technical Resistance is expected around 468.98/ 487.55/ 498.68 with Stops expected above.
On 4-Hourly chart, SlowK is Bullishly above SlowD while MACD is Bearishly below MACDAverage.
On 60-minute chart, SlowK is Bearishly below SlowD while MACD is Bullishly above MACDAverage.