Ethereum (ETH/USD) was volatile early in today’s North American session as the pair depreciated to the 471.57 area after trading as high as the 495.68 area in the Asian session. During a subsequent pullback, traders drove ETH/USD lower to the 456.50 area, a test of the 456.55 area that represented an upside price objective related to demand that emerged earlier this year around the 142.10 level. Stops were recently elected above the 469.21 and 470.06 areas during ETH/USD’s move higher, representing the 76.4% and 78.6% retracements of the depreciating range from 478.31 to 439.77. Chartists also paid close attention to the pair’s trading activity around the 461.31 area, an upside price objective related to buying pressure that emerged months ago around the 125.52 area. Additional upside price objectives that ETH/USD bulls are monitoring include the 503.54, 508.69, 510.22, 519.16, 521.13, and 524.87 levels. Some downside retracement levels include 432.71, 431.36, 427.78, 424.14, 422.81, 419.74, 415.20, 411.91, and 408.12.
During a recent pullback lower, Stops were elected below the 404.79, 400.48, 396.99, 393.50, 389.19, and 388.54 areas, retracement areas related to the recent appreciating range from 382.21 to 411.77. Following ETH/USD’s run-up, traders are paying close attention to the 403.11, 395.14, 388.69, 382.84, and 374.27 levels as areas of potential technical support. Additional areas of potential downside support include the 400.56, 395.87, 387.62, 380.03, 377.17, 367.24, 366.72, 354.44, and 353.78 areas. The 396.69 area remains an important technical level, representing the 23.6% retracement of the historical depreciation from 1419.96 to 80.60, and traders are curious to see if ETH/USD can maintain this level. Traders are observing that the 50-bar MA (4-hourly) is bullishly indicating above the 100-bar MA (4-hourly) and above the 200-bar MA (4-hourly). Also, the 50-bar MA (hourly) is bullishly indicating above the 100-bar MA (hourly) and above the 200-bar MA (hourly).
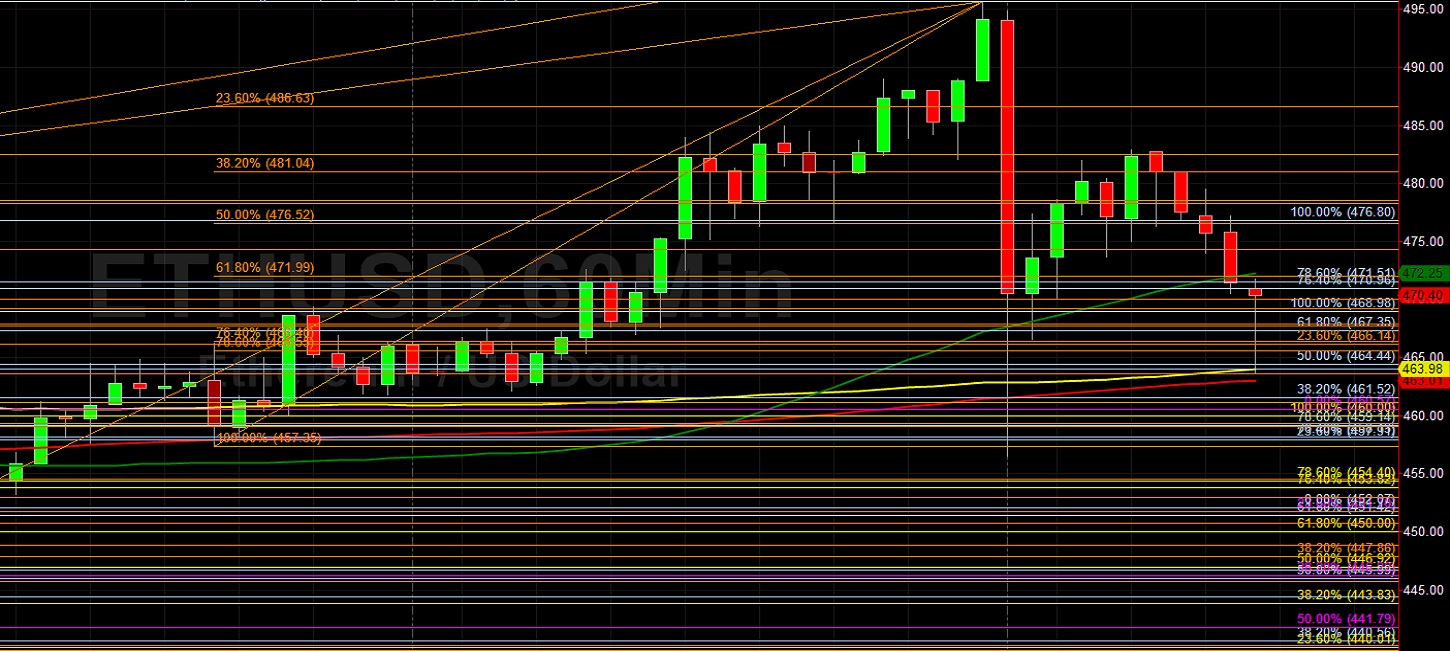
Price activity is nearest the 50-bar MA (4-hourly) at 463.79 and the 50-bar MA (Hourly) at 472.23.
Technical Support is expected around 417.60/ 388.49/ 366.72 with Stops expected below.
Technical Resistance is expected around 498.68/ 498.68/ 508.69 with Stops expected above.
On 4-Hourly chart, SlowK is Bearishly below SlowD while MACD is Bullishly above MACDAverage.
On 60-minute chart, SlowK is Bearishly below SlowD while MACD is Bearishly below MACDAverage.