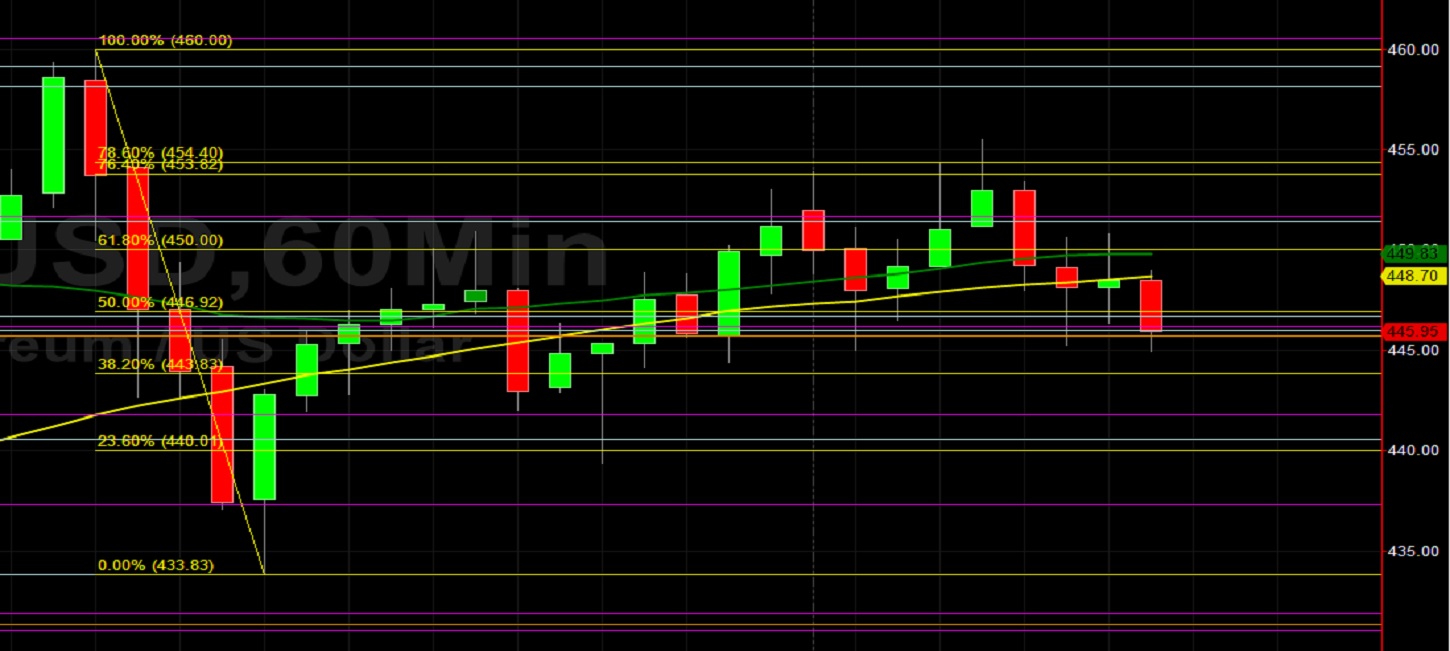
Ethereum (ETH/USD) weakened early in today’s North American session as the pair depreciated to the 445.26 area after trading as high as the 455.51 area in the European session, just above the 454.40 level that represents the 78.6% retracement of the recent depreciating range from 460.00 to 433.83. Notably, the pair traded as low as the 439.36 area during the Asian session, just below the 440.01 area that represents the 23.6% retracement of the depreciating range. Stops were recently elected below the 445.74 and 431.36 areas during the pullback, levels that represent the 23.6% and 38.2% retracements of the appreciating range from 370.50 to 468.98. Technical support has recently kept ETH/USD bid above the 421.47 area, a previous relative high. Additional downside retracement levels include 432.71, 431.36, 427.78, 424.14, 422.81, 419.74, 415.20, 411.91, and 408.12. Traders are observing that the 50-hour simple moving average is bearishly converging with the 100-hour simple moving average.
During the recent pullback lower, Stops were elected below the 404.79, 400.48, 396.99, 393.50, 389.19, and 388.54 areas, retracement areas related to the recent appreciating range from 382.21 to 411.77. Following ETH/USD’s run-up, traders are paying close attention to the 403.11, 395.14, 388.69, 382.84, and 374.27 levels as areas of potential technical support. Additional areas of potential downside support include the 400.56, 395.87, 387.62, 380.03, 377.17, 367.24, 366.72, 354.44, and 353.78 areas. The 396.69 area remains an important technical level, representing the 23.6% retracement of the historical depreciation from 1419.96 to 80.60, and traders are curious to see if ETH/USD can maintain this level. Traders are observing that the 50-bar MA (4-hourly) is bullishly indicating above the 100-bar MA (4-hourly) and above the 200-bar MA (4-hourly). Also, the 50-bar MA (hourly) is bullishly indicating above the 100-bar MA (hourly) and above the 200-bar MA (hourly).
Price activity is nearest the 50-bar MA (4-hourly) at 423.40 and the 100-bar MA (Hourly) at 448.69.
Technical Support is expected around 417.60/ 388.49/ 366.72 with Stops expected below.
Technical Resistance is expected around 468.98/ 487.55/ 498.68 with Stops expected above.
On 4-Hourly chart, SlowK is Bearishly below SlowD while MACD is Bearishly below MACDAverage.
On 60-minute chart, SlowK is Bearishly below SlowD while MACD is Bearishly below MACDAverage.