BTC/USD Within Striking Distance of 19891.99: Sally Ho's Technical Analysis 22 November 2020 BTC
Bitcoin (BTC/USD) recovered some losses early in today’s North American session as the pair appreciated to the 18301.92 area after trading as low as the 17610.77 level in the European session, a test of the 17657.16 area that represents an upside price objective related to buying demand that emerged around the 6430 area earlier this year. The pair peaked around the 18980 level late last week, just above the 18946.91 level that represents an upside price objective related to upside pressure that originated around the 6865 level earlier this year. The all-time high of BTC/USD is around the 19891.99 area, and if traders are able to establish a new peak, they will be carefully watching the 20311.36 and 21909.24 areas. Similarly, the 20534.46 area is an upside price objective related to buying demand that originated earlier this year around the 6854.67 area.
Traders will pay close attention to some potential areas of technical support during pullbacks lower and these include the 17657.16, 17306.03, 16304.69, 16092.69, and 15935.90 areas. Notably, the 15935.90 and 16304.69 areas represent the 76.4% and 78.6% retracements of a historical depreciation from 19891.99 to 3128.89. Further below current market activity, traders are paying close attention to additional potential areas of technical support during pullbacks and these include the 14273.50, 14259.01, 14101.50, 13989.55, 13892.29, 13705.50, 13663.43, and 13594.42 levels. Chartists are observing that the 50-bar MA (4-hourly) is bullishly indicating above the 100-bar MA (4-hourly) and above the 200-bar MA (4-hourly). Also, the 50-bar MA (hourly) is bullishly indicating above the 100-bar MA (hourly) and above the 200-bar MA (hourly).
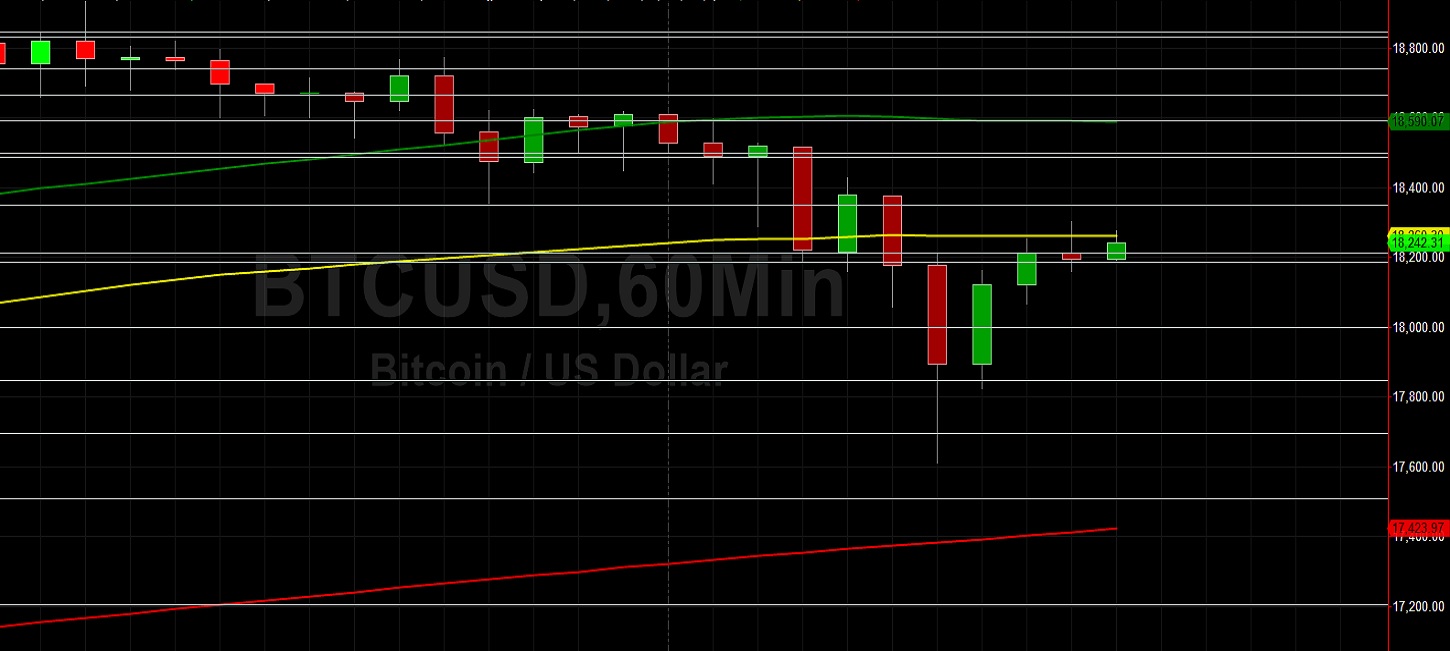
Price activity is nearest the 50-bar MA (4-hourly) at 17467.14 and the 100-bar MA (Hourly) at 18260.46.
Technical Support is expected around 17657.16/ 17306.03/ 16304.69 with Stops expected below.
Technical Resistance is expected around 19496.91/ 20311.36/ 21909.24 with Stops expected above.
On 4-Hourly chart, SlowK is Bearishly below SlowD while MACD is Bearishly below MACDAverage.
On 60-minute chart, SlowK is Bullishly above SlowD while MACD is Bearishly below MACDAverage.
