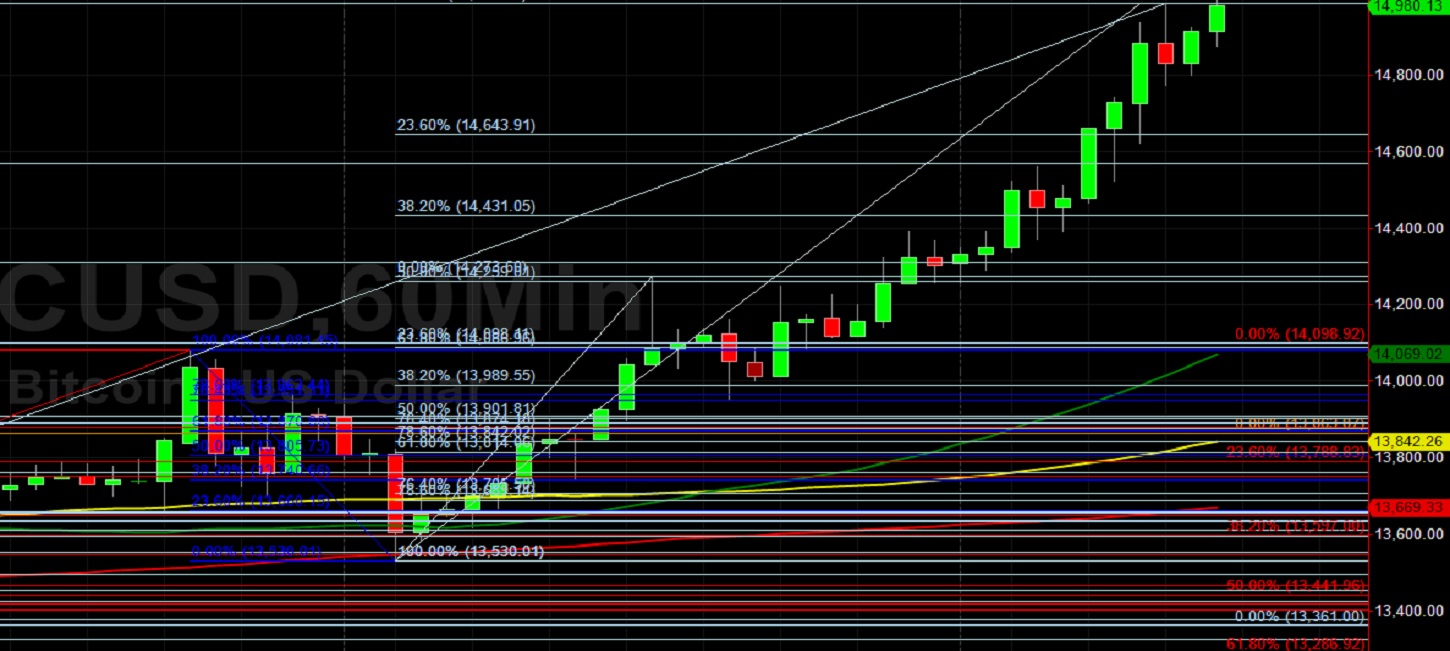
Bitcoin (BTC/USD) extended its significant climb early in today’s North American session as the pair appreciated to the 14988.00 area after trading as low as the 14000.00 area in the Asian session, just above the 38.2% retracement of the recent appreciation from 13530.01 to 14273.60. Stops have recently been elected above some key upside price objectives including 14258.88 and 14364.17, a level that represents an upside price objective related to buying pressure that emerged around the 6430.00 area. Additional Stops were triggered above the 14527.76, 14649.74, and 14825.82 areas, and tested another upside price objective around the 15007.55 area. Traders are closely watching additional upside price objectives including 15093, 15308.78, 15440.26, 15479.66, 15996.17, 16085.25 levels, and 16125.14 levels. Stops were recently elected below the 13465.76 and 13415.01 areas today during the pullback, representing the 23.6% retracements of the recent appreciating ranges from 11416.04 and 11201.00 to 14098.92. Additional downside retracement levels in these appreciating ranges include the 13074.06, 12991.91, 12757.48, 12649.96, 12440.90, and 12308.01 areas. Stops were also elected below the 13609.26, 13451.74, 13224.44, and 13197.13 levels during the recent pullback, levels related to the recent appreciating range from 12785.00 to 13863.87.
Traders are observing that the 50-hour simple moving average just bullishly moved above the 100-hour simple moving average. The 12846.65 and 12928.80 areas are significant potential areas of short-term technical support related to those appreciating ranges. Following the pair’s recent ascent, traders are paying close attention to additional potential areas of technical support during pullbacks and these include the 14643.91, 14569.57, 14431.05, 14310.71, 14273.50, 14259.01, 14101.50, 13989.55, 13892.29, 13705.50, 13663.43, and 13594.42 levels. Another important technical level includes the 11510.44 area, representing the 50% retracement of a historical depreciation from 19891.99 to 3128.89. Chartists are observing that the 50-bar MA (4-hourly) is bullishly indicating above the 100-bar MA (4-hourly) and above the 200-bar MA (4-hourly). Also, the 50-bar MA (hourly) is bullishly indicating above the 100-bar MA (hourly) and above the 200-bar MA (hourly).
Price activity is nearest the 50-bar MA (4-hourly) at 13677.56 and the 50-bar MA (Hourly) at 14068.40.
Technical Support is expected around 13260.30/ 12847.95/ 12563.28 with Stops expected below.
Technical Resistance is expected around 15093.00/ 15308.78/ 15479.66 with Stops expected above.
On 4-Hourly chart, SlowK is Bullishly above SlowD while MACD is Bullishly above MACDAverage.
On 60-minute chart, SlowK is Bullishly above SlowD while MACD is Bullishly above MACDAverage.