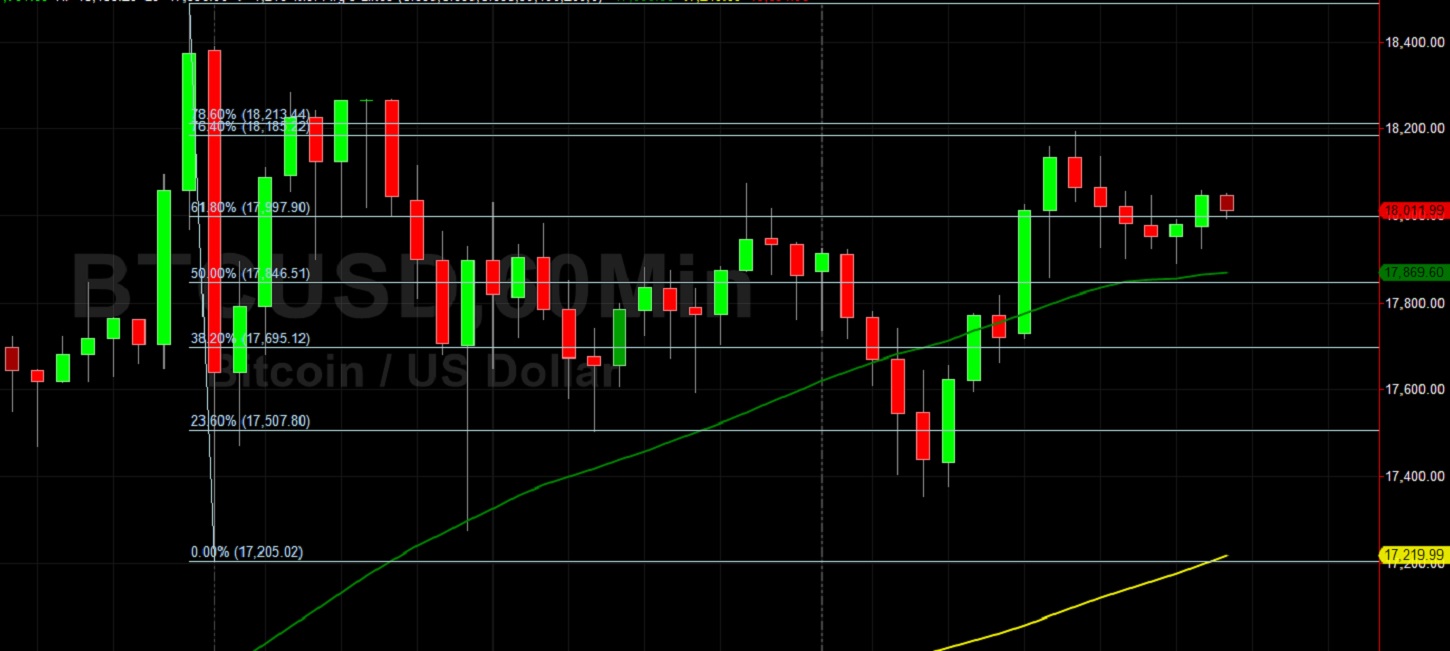
Bitcoin (BTC/USD) was volatile in today’s North American session as the pair appreciated to the 18193.29 area before settling back around the 17890 area later in the North American session, with the intraday high right around the 76.4% retracement of the recent depreciating range from 18488 to 17205.02. The pair traded as low as the 17356.00 area in the European session after encountering technical resistance around the 18075.50 level in the Asian session. The pair has recently traded at a 2020 high around the 18488.00 level, and remains in striking distance of establishing an all-time high below the psychologically-important 20000 figure. Chartists are carefully monitoring technical demand around key levels including the 17306.03, 17657.16, and 17891.76 areas. After demand recently lifted BTC/USD through technical congestion, BTC/USD challenged another upside price objective around the 18256.14 level, related to buying pressure that emerged around the 6430.00 area earlier this year.
Significant Stops were recently elected above the 15935.90 and 16304.69 areas, representing the 76.4% and 78.6% retracements of a historical depreciation from 19891.99 to 3128.89. The 16945.67 area was an upside price objective related to buying pressure that emerged around the 7963.25 area earlier this year, and served as technical support during a recent pullback. Additional upside price objectives include the 18946.91, 20311.36, 20534.46, and 21909.24 levels. During BTC/USD’s recent downward pullbacks, Stops were elected below important technical levels including 16092.69, 16057.89, 16046.30, 15969.37, 15955.45, 15856.90, 15846.05, and 15791.00. . Further below current market activity, traders are paying close attention to additional potential areas of technical support during pullbacks and these include the 14273.50, 14259.01, 14101.50, 13989.55, 13892.29, 13705.50, 13663.43, and 13594.42 levels. Another important technical level includes the 11510.44 area, representing the 50% retracement of a historical depreciation from 19891.99 to 3128.89. Chartists are observing that the 50-bar MA (4-hourly) is bullishly indicating above the 100-bar MA (4-hourly) and above the 200-bar MA (4-hourly). Also, the 50-bar MA (hourly) is bullishly indicating above the 100-bar MA (hourly) and above the 200-bar MA (hourly).
Price activity is nearest the 50-bar MA (4-hourly) at 16692.25 and the 50-bar MA (Hourly) at 17869.87.
Technical Support is expected around 15459.71/ 15214.33/ 15062.52 with Stops expected below.
Technical Resistance is expected around 18488.00/ 20311.36/ 21909.24 with Stops expected above.
On 4-Hourly chart, SlowK is Bullishly above SlowD while MACD is Bearishly below MACDAverage.
On 60-minute chart, SlowK is Bullishly above SlowD while MACD is Bullishly above MACDAverage.