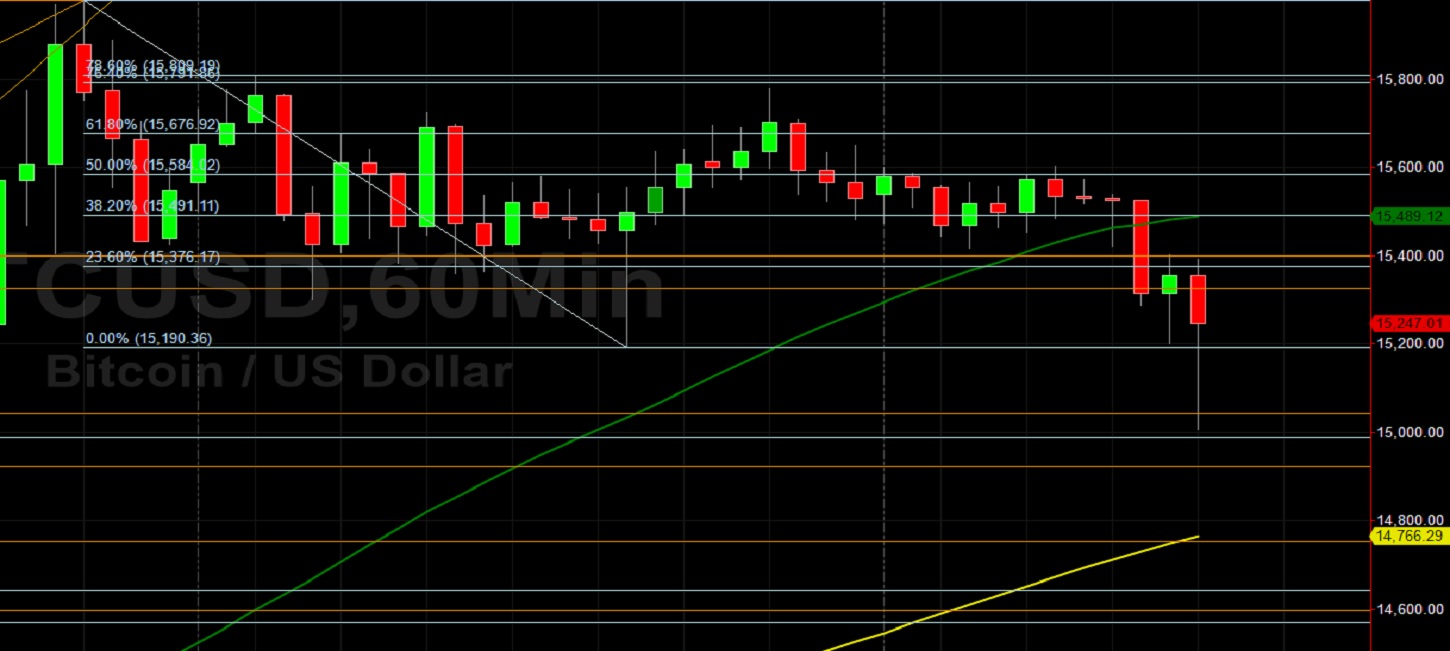
Bitcoin (BTC/USD) gave back some recent gains early in today’s North American session as the pair depreciated to the 15200.00 area after trading as high as the 15779.24 area in the Asian session, a test of the 15791.86 area that represents the 76.4% retracement of the recent depreciation from 15977.67 to 15190.36. BTC/USD’s recent 2020 high of 15977.67 represents a test of the 15996.17 area, an upside price objective related to buying pressure that emerged around the 6430 area. Stops were elected below the 15400.02, 15325.68, and 15042.66 areas during the pullback, retracement levels related to recent buying pressure that emerged around the 13215 and 13530.01 areas. Additional downside retracement levels include the 14922.33, 14753.84, 14596.34, and 14465.02 areas. Additional upside price objectives include the 16085.25 levels, 16125.14, 16275.77, 16690.89, 16815.04, and 16945.67 levels. Following the pair’s recent ascent, traders are paying close attention to additional potential areas of technical support during pullbacks and these include the 15042.66, 14988.00, 14922.33, 14753.84, 14569.57, 14310.71, 14101.50, and 13989.55 levels.
Stops were recently elected below the 13609.26, 13451.74, 13224.44, and 13197.13 levels during the recent pullback, levels related to the recent appreciating range from 12785.00 to 13863.87. Further below current market activity, traders are paying close attention to additional potential areas of technical support during pullbacks and these include the 14273.50, 14259.01, 14101.50, 13989.55, 13892.29, 13705.50, 13663.43, and 13594.42 levels. Another important technical level includes the 11510.44 area, representing the 50% retracement of a historical depreciation from 19891.99 to 3128.89. Chartists are observing that the 50-bar MA (4-hourly) is bullishly indicating above the 100-bar MA (4-hourly) and above the 200-bar MA (4-hourly). Also, the 50-bar MA (hourly) is bullishly indicating above the 100-bar MA (hourly) and above the 200-bar MA (hourly).
Price activity is nearest the 50-bar MA (4-hourly) at 14210.06 and the 100-bar MA (Hourly) at 14766.52.
Technical Support is expected around 13260.30/ 12847.95/ 12563.28 with Stops expected below.
Technical Resistance is expected around 15996.17/ 16125.14/ 16293.88 with Stops expected above.
On 4-Hourly chart, SlowK is Bearishly below SlowD while MACD is Bearishly below MACDAverage.
On 60-minute chart, SlowK is Bullishly above SlowD while MACD is Bearishly below MACDAverage.