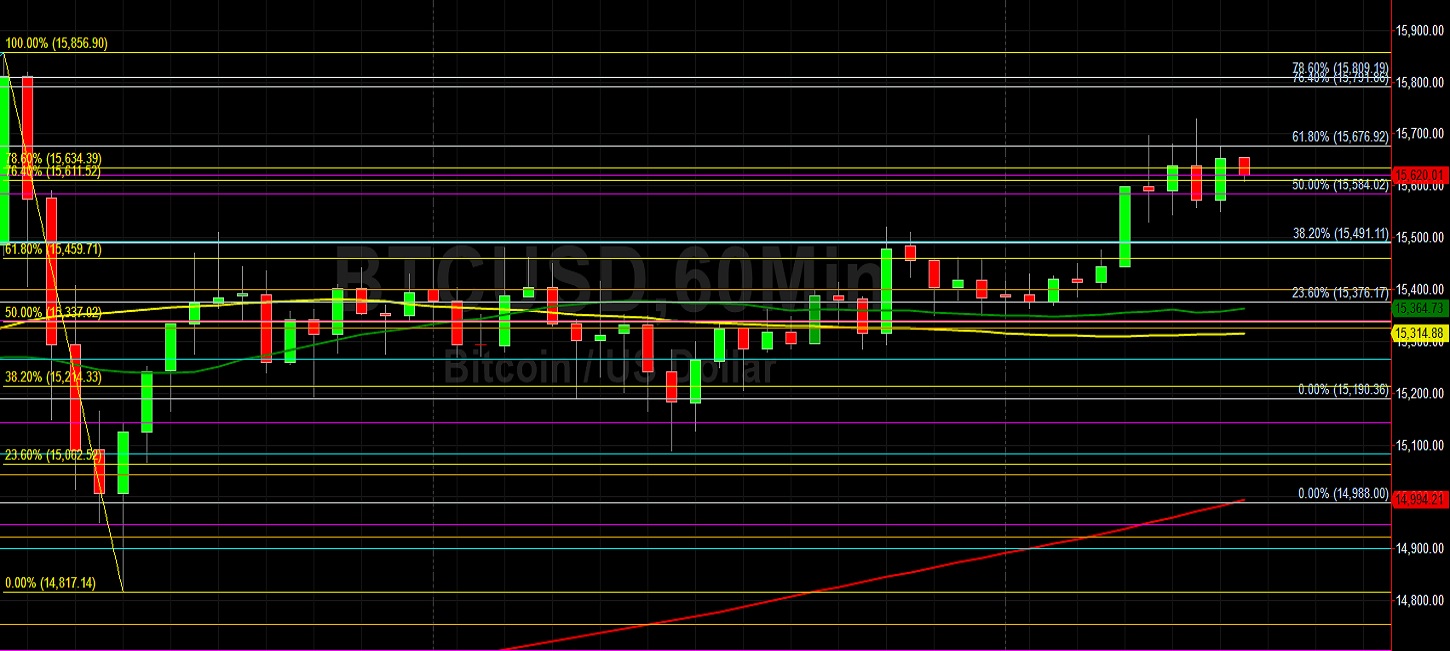
Bitcoin (BTC/USD) extended its recent comeback early in today’s North American session as the pair appreciated to the 15728.59 area after trading as low as the 15286.66 area earlier in the Asian session. Chartists note that ETH/USD then gained ground and tested the 50-hour simple moving average several times before Stops were elected above the 15611.52 and 15634.39 areas, representing the 76.4% and 78.6% retracements of the depreciating range from 15856.90 to 14817.14. Additional Stops were later triggered above the 15676.92 area, representing the 61.8% retracement of the depreciating range from 15977.67 to 15190.36. Traders are waiting to see if BTC/USD can establish a new recent relative high by appreciating above the 15977.67 level, a level that was reached during a test of the 15996.17 area, an upside price objective related to buying pressure that emerged around the 6430 area. Below current market activity, traders are monitoring the 15143.84, 15062.52, 14947.05, 14817.14, and 14703.57 levels as possible areas of technical support. Additional downside retracement levels include the 14922.33, 14753.84, 14596.34, and 14465.02 areas. Additional upside price objectives include the 16085.25 levels, 16125.14, 16275.77, 16690.89, 16815.04, and 16945.67 levels.
Stops were recently elected below the 13609.26, 13451.74, 13224.44, and 13197.13 levels during the recent pullback, levels related to the recent appreciating range from 12785.00 to 13863.87. Further below current market activity, traders are paying close attention to additional potential areas of technical support during pullbacks and these include the 14273.50, 14259.01, 14101.50, 13989.55, 13892.29, 13705.50, 13663.43, and 13594.42 levels. Another important technical level includes the 11510.44 area, representing the 50% retracement of a historical depreciation from 19891.99 to 3128.89. Chartists are observing that the 50-bar MA (4-hourly) is bullishly indicating above the 100-bar MA (4-hourly) and above the 200-bar MA (4-hourly). Also, the 50-bar MA (hourly) is bullishly indicating above the 100-bar MA (hourly) and above the 200-bar MA (hourly).
Price activity is nearest the 50-bar MA (4-hourly) at 15022.68 and the 50-bar MA (Hourly) at 15364.92.
Technical Support is expected around 13260.30/ 12847.95/ 12563.28 with Stops expected below.
Technical Resistance is expected around 15996.17/ 16125.14/ 16293.88 with Stops expected above.
On 4-Hourly chart, SlowK is Bullishly above SlowD while MACD is Bearishly below MACDAverage.
On 60-minute chart, SlowK is Bearishly below SlowD while MACD is Bullishly above MACDAverage.