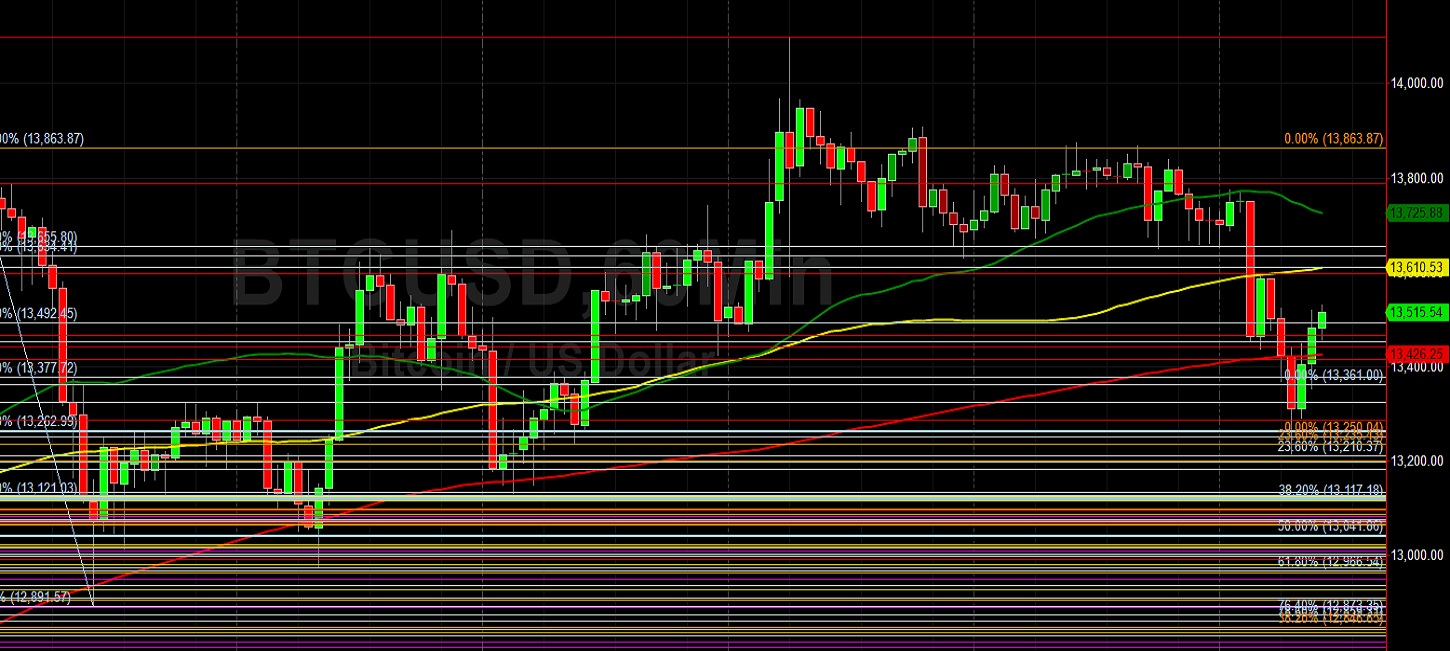
Bitcoin (BTC/USD) gained back some lost ground early in today’s North American session as the pair appreciated to the 13519.00 area after trading as low as the 13215.00 area earlier in the North American session. The technical significance of the 13863.87 area became evident again multiple times over the weekend when BTC/USD encountered technical resistance around the level. Traders also encountered technical resistance around the 50-hour simple moving average during the European session and that drove BTC/USD to test the 23.6% retracement of the recent appreciating range from 11201 to 13863.87. Stops were elected below the 13465.76 and 13415.01 areas today during the pullback, representing the 23.6% retracements of the recent appreciating ranges from 11416.04 and 11201.00 to 14098.92. Additional downside retracement levels in these appreciating ranges include the 13074.06, 12991.91, 12757.48, 12649.96, 12440.90, and 12308.01 areas. . Stops were elected below the 13609.26, 13451.74, 13224.44, and 13197.13 levels during the recent pullback, levels related to the recent appreciating range from 12785.00 to 13863.87.
The 12846.65 and 12928.80 areas are significant potential areas of short-term technical support related to those appreciating ranges. Following the pair’s recent ascent, traders are paying close attention to additional potential areas of technical support during pullbacks and these include the 12925.89, 12817.22, 12766.47, 12611.92, 12549.45, 12514.94, 12438.90, 12060.18, 11937.09, 11692.63, and 11531.52 areas. Stops were recently elected above many additional upside price objectives including the 11120, 11179.90, 11272.86, 11378.11, 11409.40, 11489.10, 11857.25, 11915.92, and 12023.45 levels. Another important technical level includes the 11510.44 area, representing the 50% retracement of a historical depreciation from 19891.99 to 3128.89, as well as the 10200.39, 10139.11, and 10082.97 areas. Chartists are observing that the 50-bar MA (4-hourly) is bullishly indicating above the 100-bar MA (4-hourly) and above the 200-bar MA (4-hourly). Also, the 50-bar MA (hourly) is bullishly indicating above the 100-bar MA (hourly) and above the 200-bar MA (hourly).
Price activity is nearest the 50-bar MA (4-hourly) at 13427.17 and the 200-bar MA (Hourly) at 13426.13.
Technical Support is expected around 12976.29/ 12772.83/ 12563.28 with Stops expected below.
Technical Resistance is expected around 14098.92/ 14364.17/ 14825.82 with Stops expected above.
On 4-Hourly chart, SlowK is Bearishly below SlowD while MACD is Bearishly below MACDAverage.
On 60-minute chart, SlowK is Bullishly above SlowD while MACD is Bearishly below MACDAverage.