Bitcoin (BTC/USD) gained ground early in today’s North American session as the pair appreciated to the 16325.99 area after trading as low as the 16085.00 area earlier in the European session, a test of the 16092.69 area that represents the 38.2% retracement of the recent appreciating range from 15446.82 to 16491.92, and a test of the 16094.44 area that represents the 23.6% retracement of the appreciating range from 14817.14 to 16489.00. Traders are observing some downward retracement levels related to the appreciation from 14310 to 16489.00 and these include 15974.76, 15656.62, 15399.50, 15142.38, and 14824.24. Stops were recently elected above the 15611.52, 15634.39, and 15676.92 areas. Below current market activity, traders are monitoring the 15143.84, 15062.52, 14947.05, 14817.14, and 14703.57 levels as possible areas of technical support. Additional downside retracement levels include the 14922.33, 14753.84, 14596.34, and 14465.02 areas. Additional upside price objectives include the 16690.89, 16815.04, and 16945.67 levels.
Stops were also recently elected below the 13609.26, 13451.74, 13224.44, and 13197.13 levels during the recent pullback, levels related to the recent appreciating range from 12785.00 to 13863.87. Further below current market activity, traders are paying close attention to additional potential areas of technical support during pullbacks and these include the 14273.50, 14259.01, 14101.50, 13989.55, 13892.29, 13705.50, 13663.43, and 13594.42 levels. Another important technical level includes the 11510.44 area, representing the 50% retracement of a historical depreciation from 19891.99 to 3128.89. Chartists are observing that the 50-bar MA (4-hourly) is bullishly indicating above the 100-bar MA (4-hourly) and above the 200-bar MA (4-hourly). Also, the 50-bar MA (hourly) is bullishly indicating above the 100-bar MA (hourly) and above the 200-bar MA (hourly).
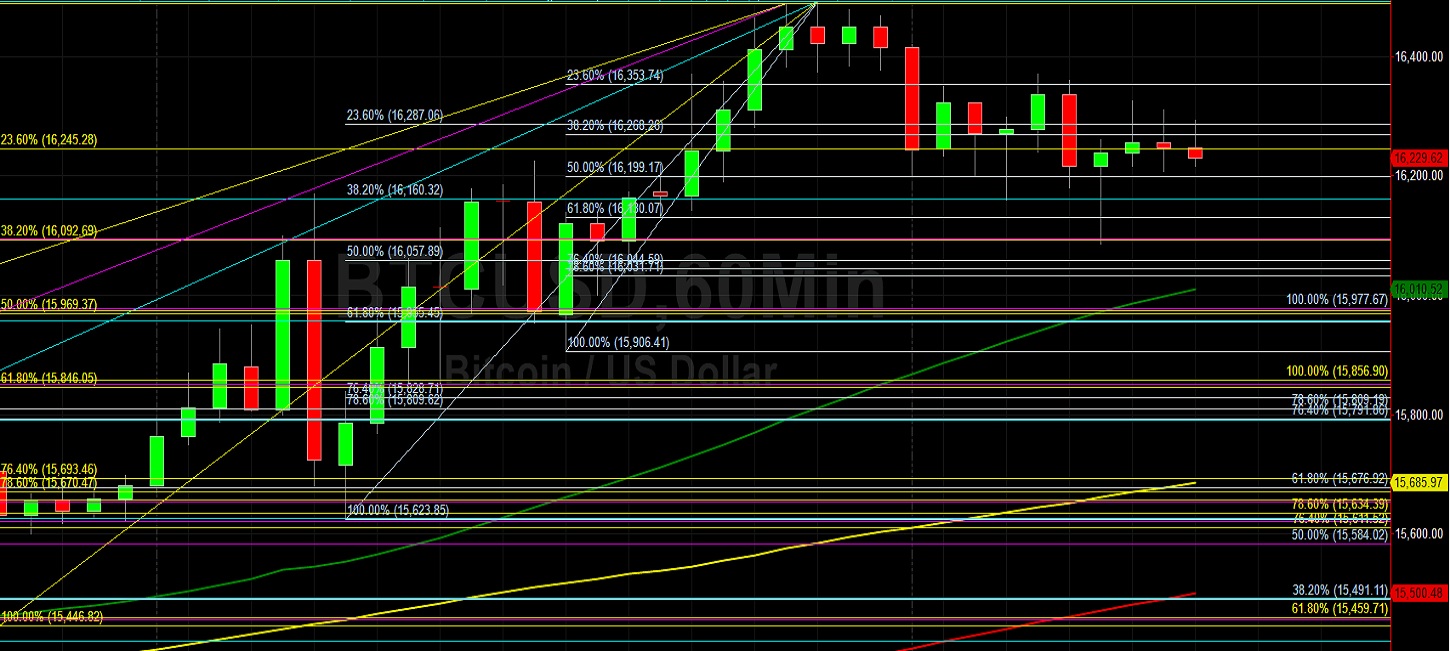
Price activity is nearest the 50-bar MA (4-hourly) at 15536.02 and the 50-bar MA (Hourly) at 16010.49.
Technical Support is expected around 15459.71/ 15214.33/ 15062.52 with Stops expected below.
Technical Resistance is expected around 16491.92/ 16690.89/ 16815.04 with Stops expected above.
On 4-Hourly chart, SlowK is Bearishly below SlowD while MACD is Bullishly above MACDAverage.
On 60-minute chart, SlowK is Bullishly above SlowD while MACD is Bearishly below MACDAverage.