Bitcoin (BTC/USD) notched upside gains early in today’s North American session as the pair appreciated to the 15962.78 area after trading as low as the 15446.82 area earlier in the Asian session, representing a test of the 50-hour simple moving average and the 61.8% retracement of the depreciating range from 15856.90 to 14817.14. During yesterday’s North American session, Stops were elected above the 15977.67 area, an upside price objective related to buying pressure that emerged around the 13215.00 area. The pair went on then trade as high as the 16000 area, and then traded as high as the 16169 area during today’s European session. Stops were recently elected above the 15611.52, 15634.39, and 15676.92 areas. Below current market activity, traders are monitoring the 15143.84, 15062.52, 14947.05, 14817.14, and 14703.57 levels as possible areas of technical support. Additional downside retracement levels include the 14922.33, 14753.84, 14596.34, and 14465.02 areas. Additional upside price objectives include the 16275.77, 16690.89, 16815.04, and 16945.67 levels.
Stops were recently elected below the 13609.26, 13451.74, 13224.44, and 13197.13 levels during the recent pullback, levels related to the recent appreciating range from 12785.00 to 13863.87. Further below current market activity, traders are paying close attention to additional potential areas of technical support during pullbacks and these include the 14273.50, 14259.01, 14101.50, 13989.55, 13892.29, 13705.50, 13663.43, and 13594.42 levels. Another important technical level includes the 11510.44 area, representing the 50% retracement of a historical depreciation from 19891.99 to 3128.89. Chartists are observing that the 50-bar MA (4-hourly) is bullishly indicating above the 100-bar MA (4-hourly) and above the 200-bar MA (4-hourly). Also, the 50-bar MA (hourly) is bullishly indicating above the 100-bar MA (hourly) and above the 200-bar MA (hourly).
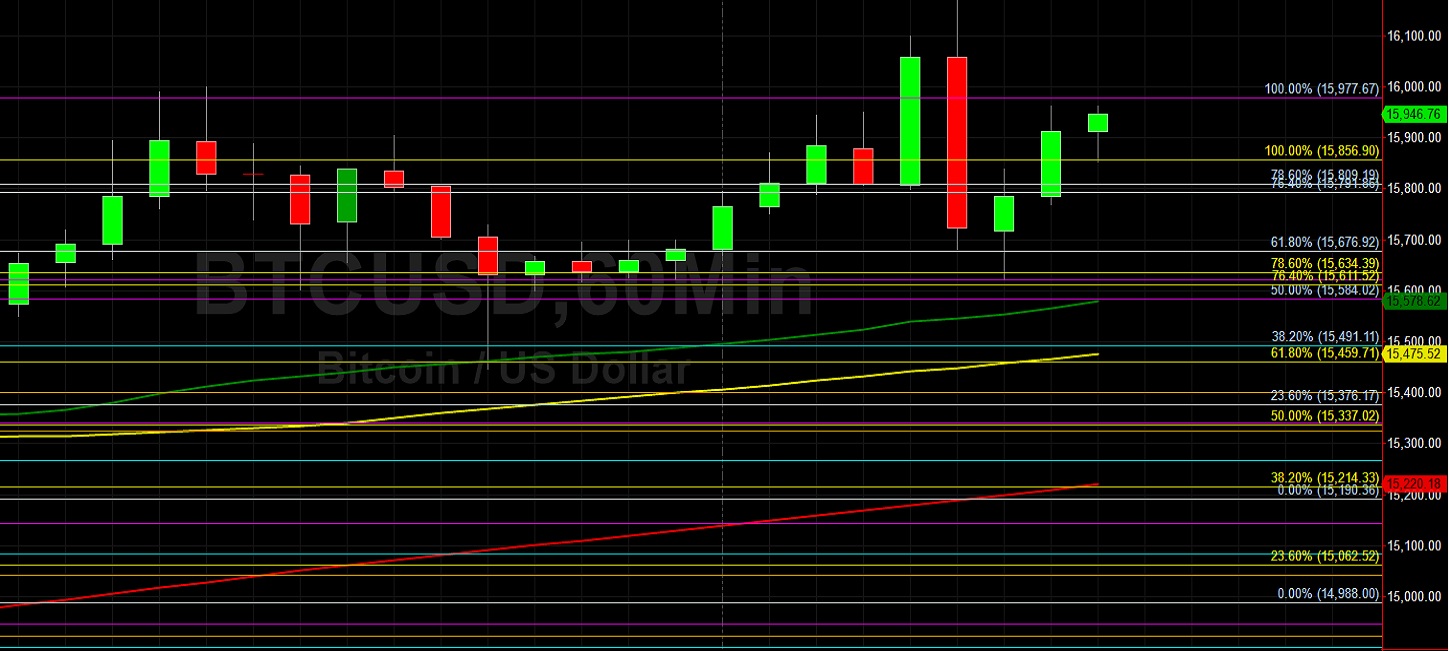
Price activity is nearest the 50-bar MA (4-hourly) at 15272.83 and the 50-bar MA (Hourly) at 15578.64.
Technical Support is expected around 15459.71/ 15214.33/ 15062.52 with Stops expected below.
Technical Resistance is expected around 16275.77/ 16690.89/ 16815.04 with Stops expected above.
On 4-Hourly chart, SlowK is Bullishly above SlowD while MACD is Bullishly above MACDAverage.
On 60-minute chart, SlowK is Bullishly above SlowD while MACD is Bullishly above MACDAverage.