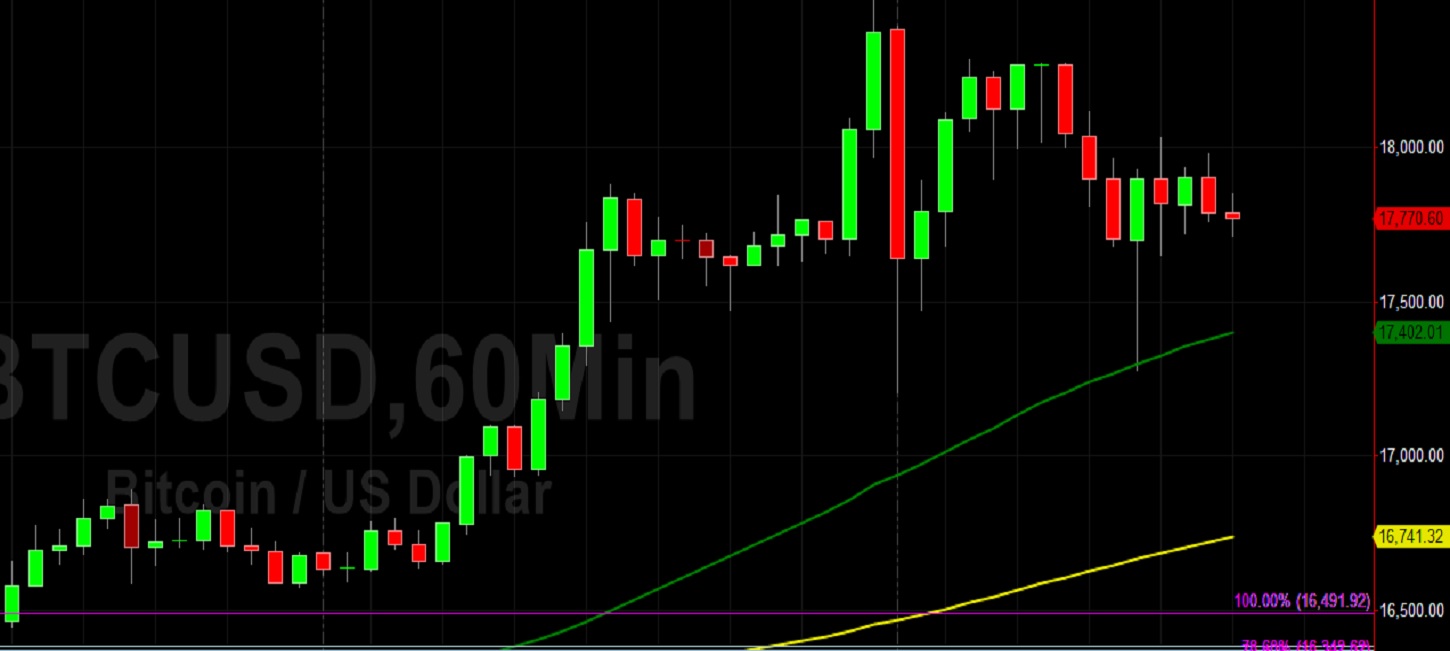
Bitcoin (BTC/USD) was volatile in today’s North American session as the pair appreciated to the 18269.16 before trading as low as the 17275.04 area, a test of the 50-hour simple moving average. The pair had earlier traded as high as the 18488.00 level during the Asian session before sharp selling pressure abruptly knocked BTC/USD lower to the 17205.02 area. A few key technical levels have emerged during recent trading activity. The 17891.76 area represented an upside price objective related to buying pressure that emerged earlier this year around the 7671.00 area. After demand lifted BTC/USD through that congestion, BTC/USD challenged another upside price objective around the 18256.14 level, related to buying pressure that emerged around the 6430.00 area earlier this year. Stops were elected and lifted BTC/USD to a fresh 2020 high around the 18488.00 area. During retracements lower, technical levels including the 17657.16 and 17306.03 areas provided technical support.
Significant Stops were recently elected above the 15935.90 and 16304.69 areas, representing the 76.4% and 78.6% retracements of a historical depreciation from 19891.99 to 3128.89. The 16945.67 area was an upside price objective related to buying pressure that emerged around the 7963.25 area earlier this year, and served as technical support during a recent pullback. Additional upside price objectives include the 18946.91, 20311.36, 20534.46, and 21909.24 levels. During BTC/USD’s recent downward pullbacks, Stops were elected below important technical levels including 16092.69, 16057.89, 16046.30, 15969.37, 15955.45, 15856.90, 15846.05, and 15791.00. Traders are observing some downward retracement levels related to the appreciation from 14310 to 16489.00 and these include 15974.76, 15656.62, 15399.50, 15142.38, and 14824.24.
Below current market activity, traders are monitoring the 15143.84, 15062.52, 14947.05, 14817.14, and 14703.57 levels as possible areas of technical support. Additional downside retracement levels include the 14922.33, 14753.84, 14596.34, and 14465.02 areas. Stops were also recently elected below the 13609.26, 13451.74, 13224.44, and 13197.13 levels during the recent pullback, levels related to the recent appreciating range from 12785.00 to 13863.87. Further below current market activity, traders are paying close attention to additional potential areas of technical support during pullbacks and these include the 14273.50, 14259.01, 14101.50, 13989.55, 13892.29, 13705.50, 13663.43, and 13594.42 levels. Another important technical level includes the 11510.44 area, representing the 50% retracement of a historical depreciation from 19891.99 to 3128.89. Chartists are observing that the 50-bar MA (4-hourly) is bullishly indicating above the 100-bar MA (4-hourly) and above the 200-bar MA (4-hourly). Also, the 50-bar MA (hourly) is bullishly indicating above the 100-bar MA (hourly) and above the 200-bar MA (hourly).
Price activity is nearest the 50-bar MA (4-hourly) at 16359.24 and the 50-bar MA (Hourly) at 17401.90.
Technical Support is expected around 15459.71/ 15214.33/ 15062.52 with Stops expected below.
Technical Resistance is expected around 18488.00/ 20311.36/ 21909.24 with Stops expected above.
On 4-Hourly chart, SlowK is Bearishly below SlowD while MACD is Bullishly above MACDAverage.
On 60-minute chart, SlowK is Bearishly below SlowD while MACD is Bearishly below MACDAverage.