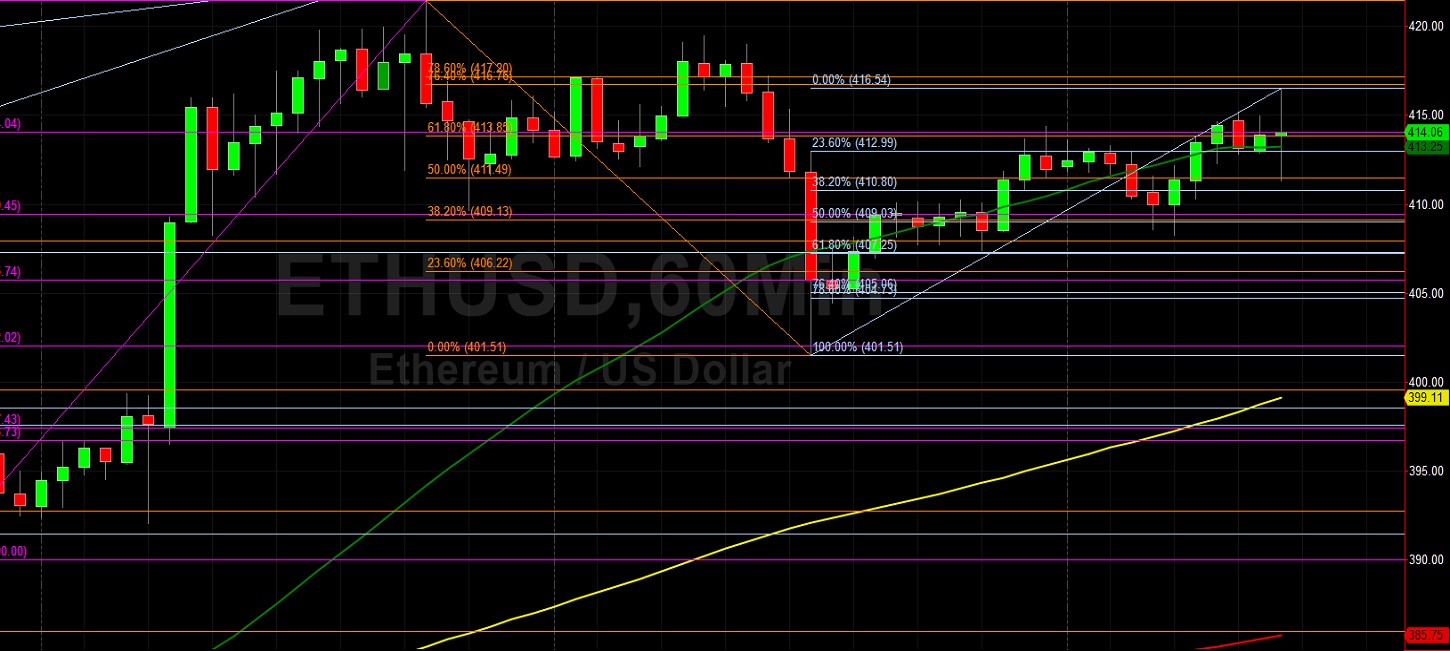
Ethereum (ETH/USD) was volatile early in today’s North American session as the pair appreciated to the 416.54 area before depreciating as low as the 411.31 area during the Asian session, right around the 50% retracement of the depreciating range from 421.47 to 401.51. Notably, the pair’s spike to intraday highs saw ETH/USD test the 76.4% retracement of the same depreciating range. One appreciating range that traders are monitoring is the climb from 401.51 to 416.51, and some downside retracement levels include 410.80, 409.03, 407.25, and 405.06. One appreciating range that traders continue to monitor is the ascent from 364.04 to 421.47, with the 407.92, 399.53, 392.76, and 385.98 areas representing important retracement levels. Another technically significant appreciating range is the climb from 390.00 to 421.47, with the 414.04, 409.45, 405.74, 402.02, and 397.43 areas representing important retracement levels. Stops were recently elected above the 378.85 and 399.87 levels during the pair’s ascent, representing the 38.2% and 50% retracements of the recent depreciating range from 488.95 to 310.79.
Additional upside retracement levels related to the depreciating range include 420.89 and 446.90. Additional upside price objectives include 425.31, 427.78, and 437.41. Following ETH/USD’s run-up, traders are paying close attention to the 403.11, 395.14, 388.69, 382.84, and 374.27 levels as areas of potential technical support. Additional areas of potential upside pressure include the 393.37, 379.37, and 368.05 levels. The 396.69 area remains an important technical level, representing the 23.6% retracement of the historical depreciation from 1419.96 to 80.60, and traders are curious to see if ETH/USD can maintain this level. Traders are observing that the 50-bar MA (4-hourly) is bullishly indicating above the 100-bar MA (4-hourly) and above the 200-bar MA (4-hourly). Also, the 50-bar MA (hourly) is bullishly indicating above the 200-bar MA (hourly) and above the 100-bar MA (hourly).
Price activity is nearest the 50-bar MA (4-hourly) at 386.21 and the 50-bar MA (Hourly) at 413.26.
Technical Support is expected around 315.08/ 302.20/ 279.77 with Stops expected below.
Technical Resistance is expected around 421.47/ 437.41/ 454.79 with Stops expected above.
On 4-Hourly chart, SlowK is Bullishly above SlowD while MACD is Bearishly below MACDAverage.
On 60-minute chart, SlowK is Bearishly below SlowD while MACD is Bullishly above MACDAverage.