Ethereum (ETH/USD) extended recent gains early in today’s North American session as the pair appreciated to the 416.00 area after trading as low as the 364.04 area during the Asian session. Stops were elected above the 378.85 and 399.87 levels during the pair’s ascent, representing the 38.2% and 50% retracements of the recent depreciating range from 488.95 to 310.79. Additional upside retracement levels related to the depreciating range include 420.89 and 446.90. Some minor Stops were also triggered above the 415.20 area, representing the 23.6% retracement of the appreciating range from 176.43 to 488.95. Additional upside price objectives include 418.79, 425.31, 427.78, and 437.41. Traders are observing that the 100-hour simple moving average has bullishly moved above the 200-hour simple moving average.
Following ETH/USD’s run-up, traders are paying close attention to the 403.11, 395.14, 388.69, 382.84, and 374.27 levels as areas of potential technical support. Additional areas of potential upside pressure include the 393.37, 379.37, and 368.05 levels. The 396.69 area remains an important technical level, representing the 23.6% retracement of the historical depreciation from 1419.96 to 80.60, and traders are curious to see if ETH/USD can reclaim this level. Traders are observing that the 50-bar MA (4-hourly) is bullishly indicating above the 100-bar MA (4-hourly) and above the 200-bar MA (4-hourly). Also, the 50-bar MA (hourly) is bullishly indicating above the 200-bar MA (hourly) and above the 100-bar MA (hourly).
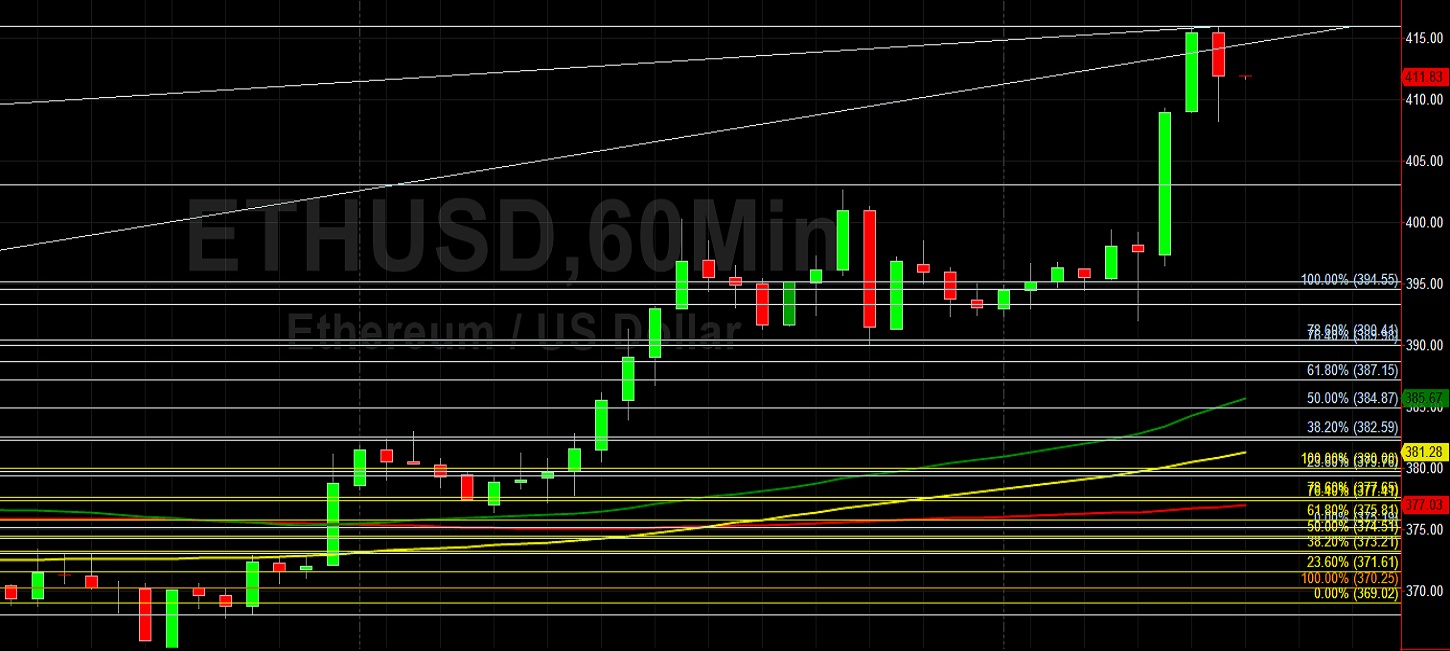
Price activity is nearest the 50-bar MA (4-hourly) at 377.36 and the 50-bar MA (Hourly) at 385.68.
Technical Support is expected around 315.08/ 302.20/ 279.77 with Stops expected below.
Technical Resistance is expected around 420.89/ 437.41/ 454.79 with Stops expected above.
On 4-Hourly chart, SlowK is Bullishly above SlowD while MACD is Bullishly above MACDAverage.
On 60-minute chart, SlowK is Bearishly below SlowD while MACD is Bullishly above MACDAverage.