Crypto Price Analysis for Oct. 21, 2020: BTC, ETH, LTC, BCH, TRX

This analysis brought to you by RoboForex.
The cryptocurrency market is demonstrating some positive dynamics. Bitcoin is attacking the short-term high, a breakout of which may push the instrument towards $15,000. Other cryptoassets aren’t so aggressive but they are also ready to move upwards and break their respective resistance areas. On the other hand, the unwillingness of BTC/USD to fix above $12,495 and then rebound to the downside may hint at an attempt to form a Double Top reversal pattern, that’s why it’s very important for bulls to break the above-mentioned level in the nearest future. Such a breakout will be a good signal in favor of further ascending movement for the entire cryptocurrency market.
Bitcoin
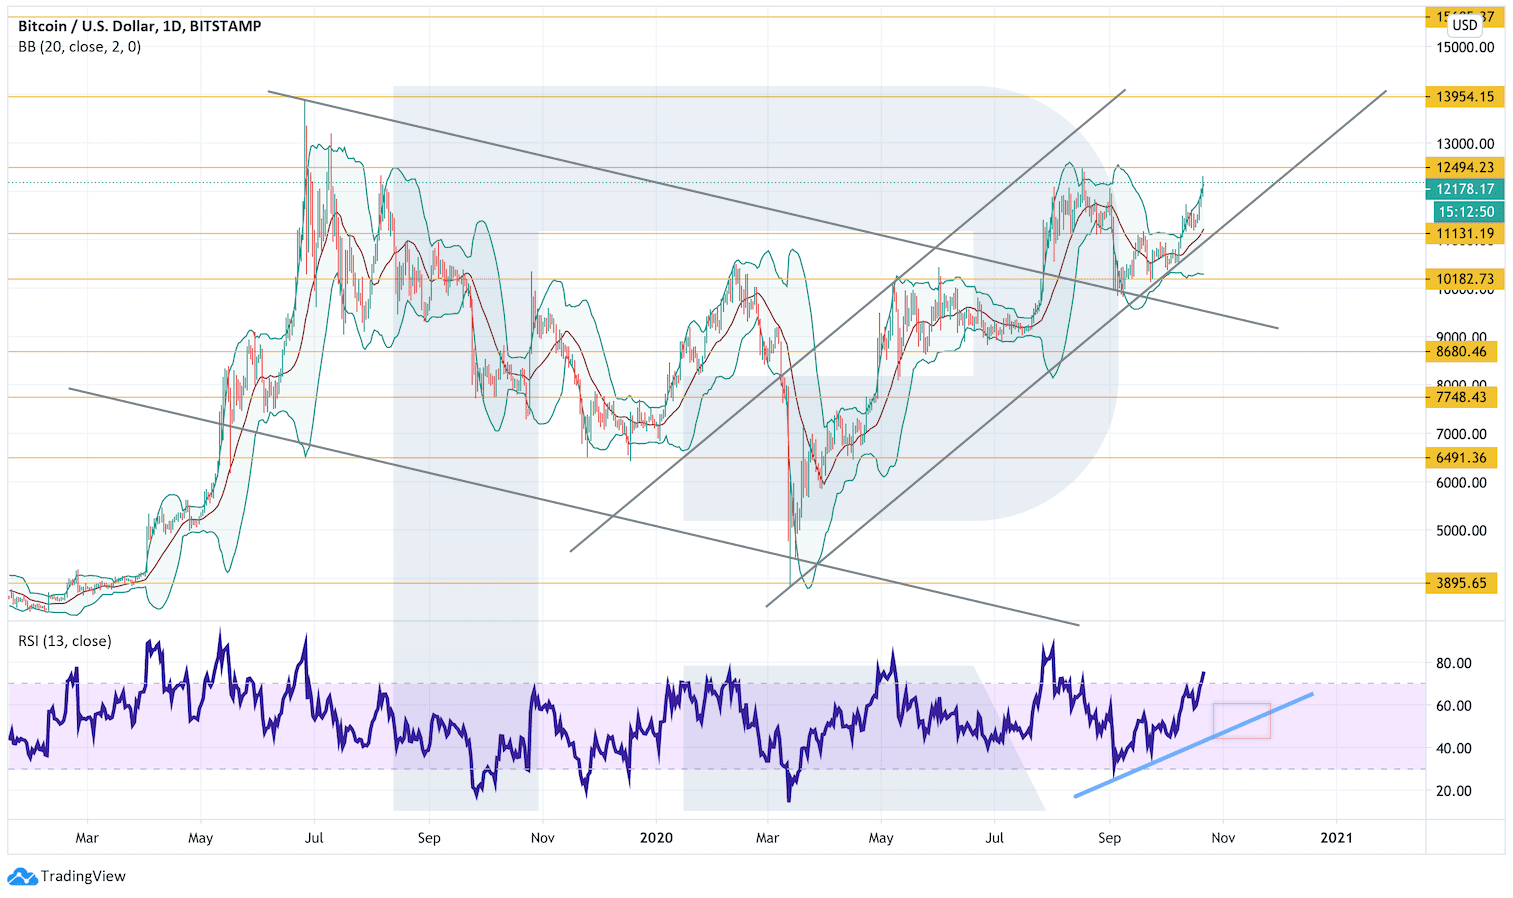
In the daily chart, Bitcoin has almost reached the closest local high at $12,495. A breakout of this level will indicate further growth towards $13б955. As one can see, bulls have been able to cancel the formation of a Head & Shoulders reversal pattern, that’s why there is a potential for further ascending movement to cover the distance equal to the pattern’s height and reach $15,605. However, to confirm this idea, the price must break the resistance area and fix above $12,495. Still, this scenario may no longer be valid if the asset breaks the rising channel’s downside border and fixes below $11,130. After that, the instrument may continue trading downwards with the target at $10,180.
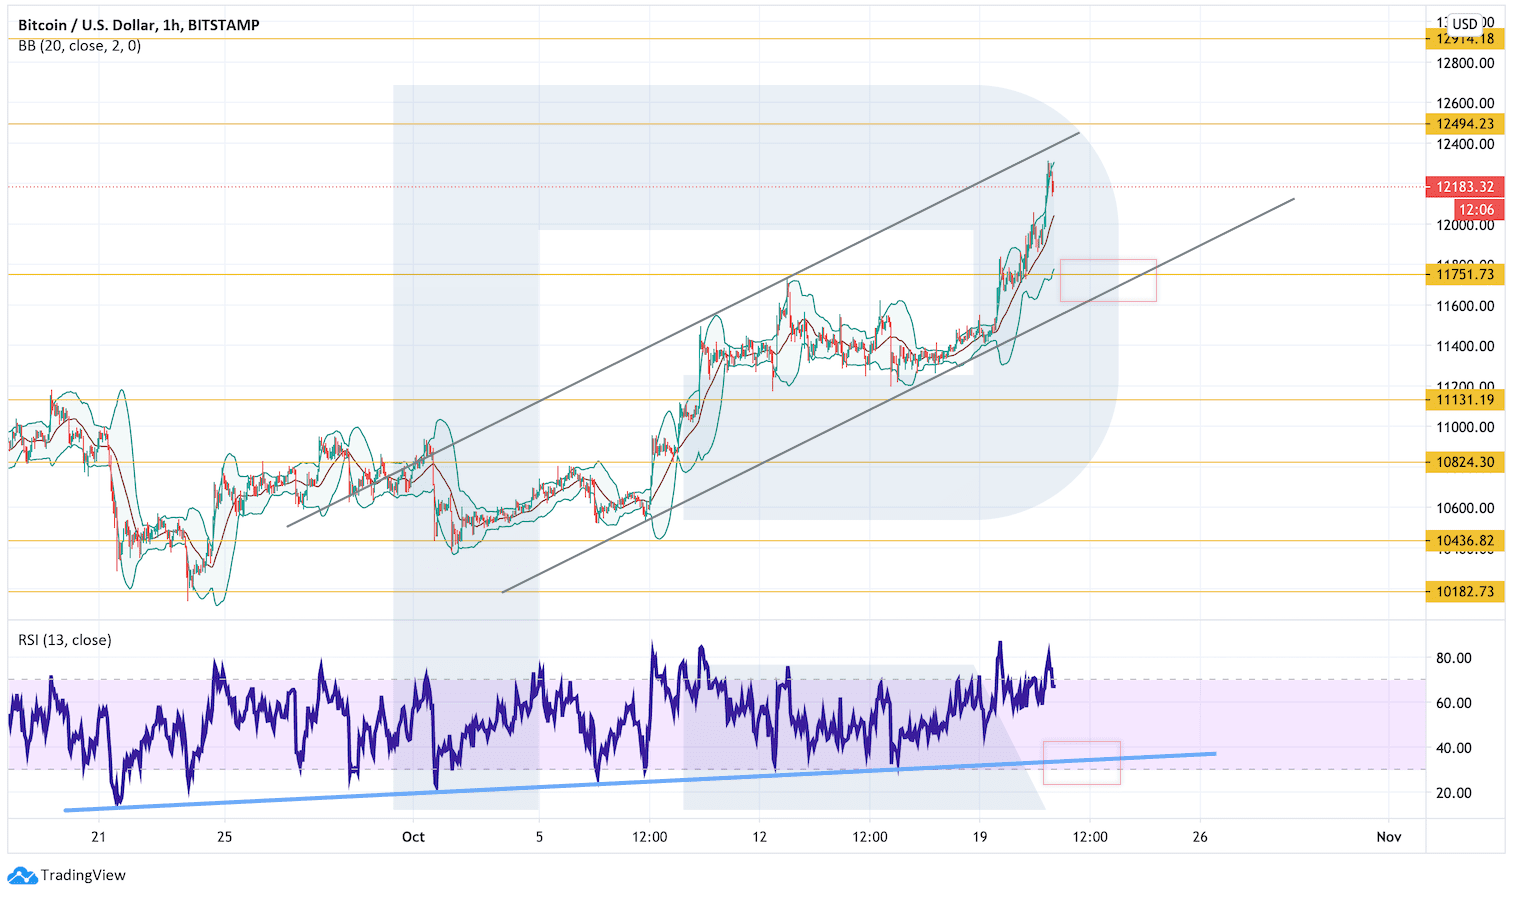
As we can see in the H4 chart, BTC/USD is steadily growing within the rising channel. The RSI is rebounding from the support line, which is a signal in favor of a breakout of the resistance line soon. However, one shouldn’t exclude the possibility of a new correction to test the rising channel’s downside border at $11,750 before another wave to the upside. Still, this scenario may be canceled if the price breaks the support area and fixes below $11,545. In this case, the instrument may continue the descending correction towards $10,185.
Ethereum
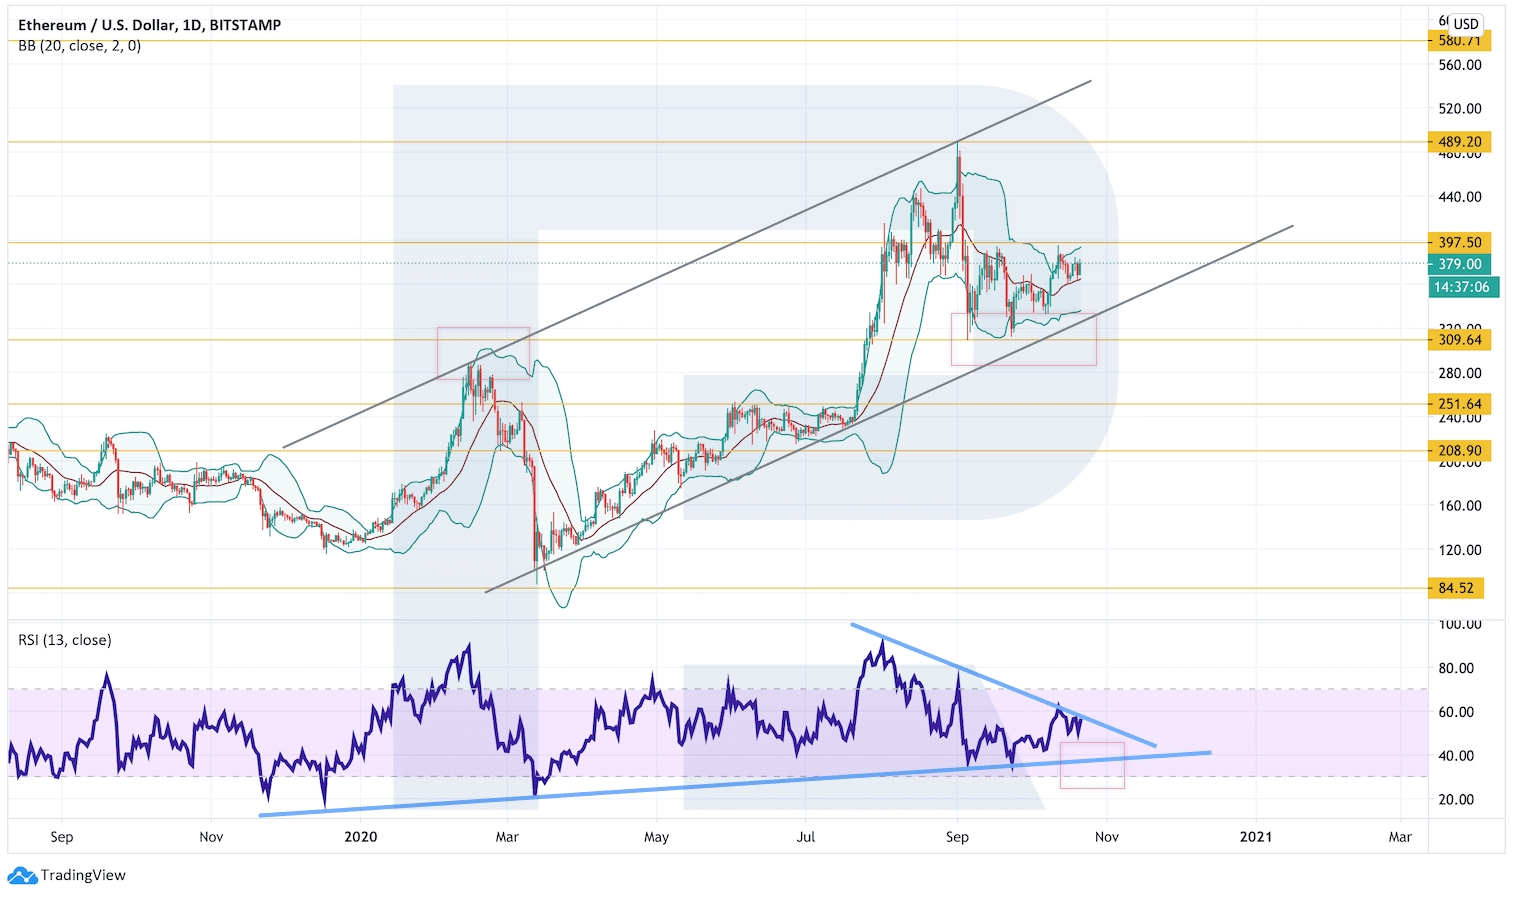
As we can see in the daily chart, ETH/USD continues testing the resistance area. After the closing price breaks $397, the cryptocurrency is expected to continue growing towards $490. The RSI hasn’t been able to break the descending trendline; such a breakout will indicate steady growth to reach the local high. However, the bullish scenario may no longer be valid if the market breaks the rising channel’s downside border and fixes below $309. In this case, the next downside target will be at $208.
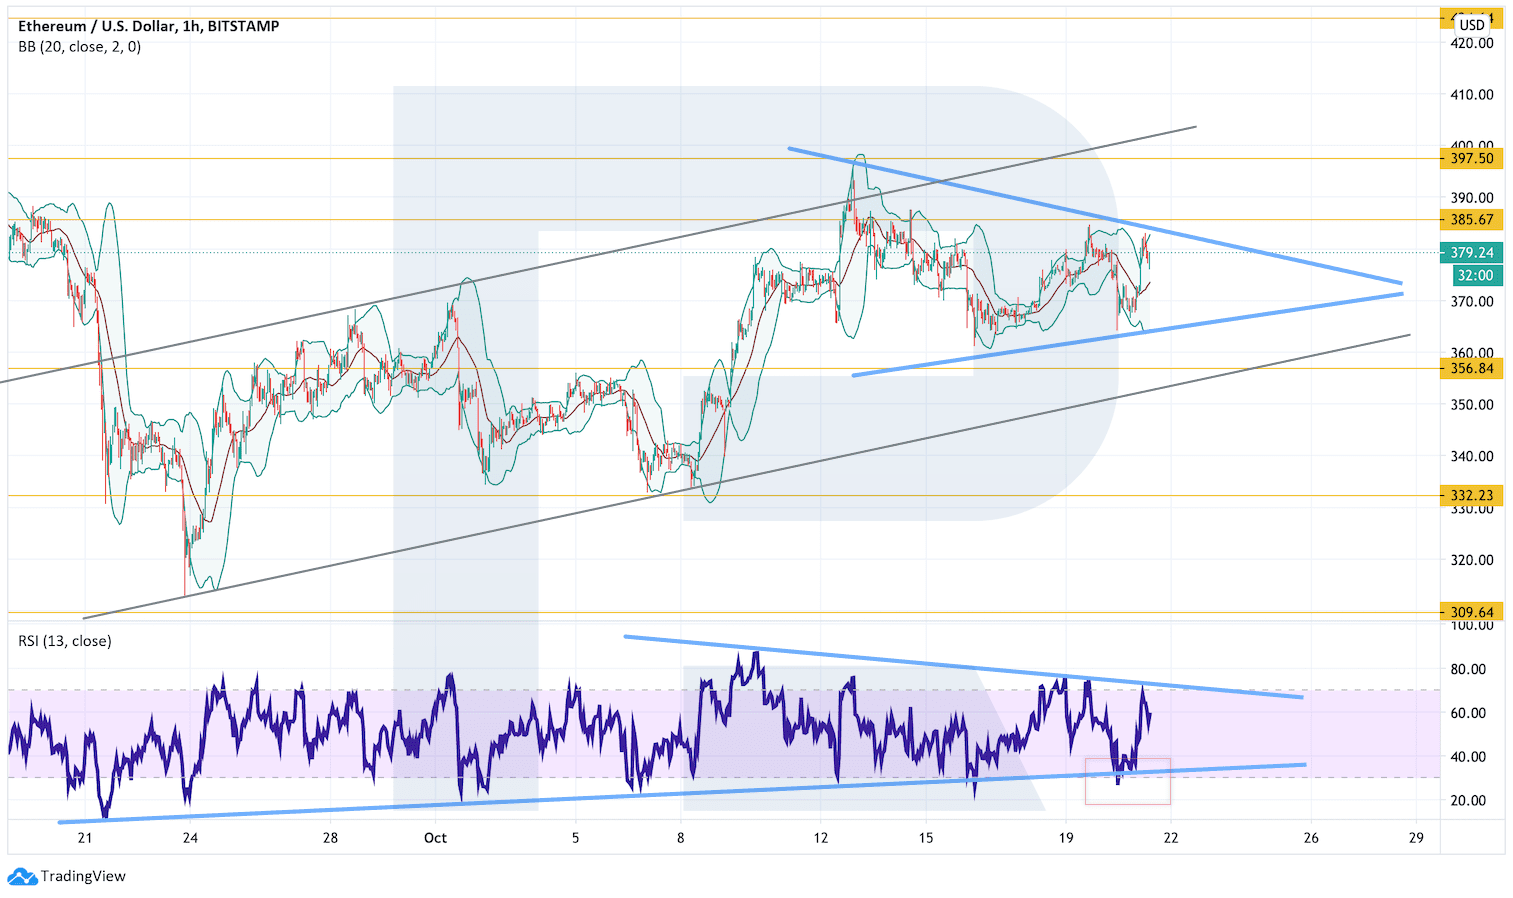
On shorter timeframes, the cryptocurrency is stuck inside a Triangle pattern again. After breaking the pattern’s upside border and fixing above $385, the pair may continue trading upwards and completely materialize the pattern with the target at $430. A strong signal in favor of this idea is another rebound from the support line at the RSI. However, this bullish scenario may be canceled if the market breaks the pattern’s downside border and fixes below $356. After that, the instrument may continue the descending correction to reach $332.
Litecoin
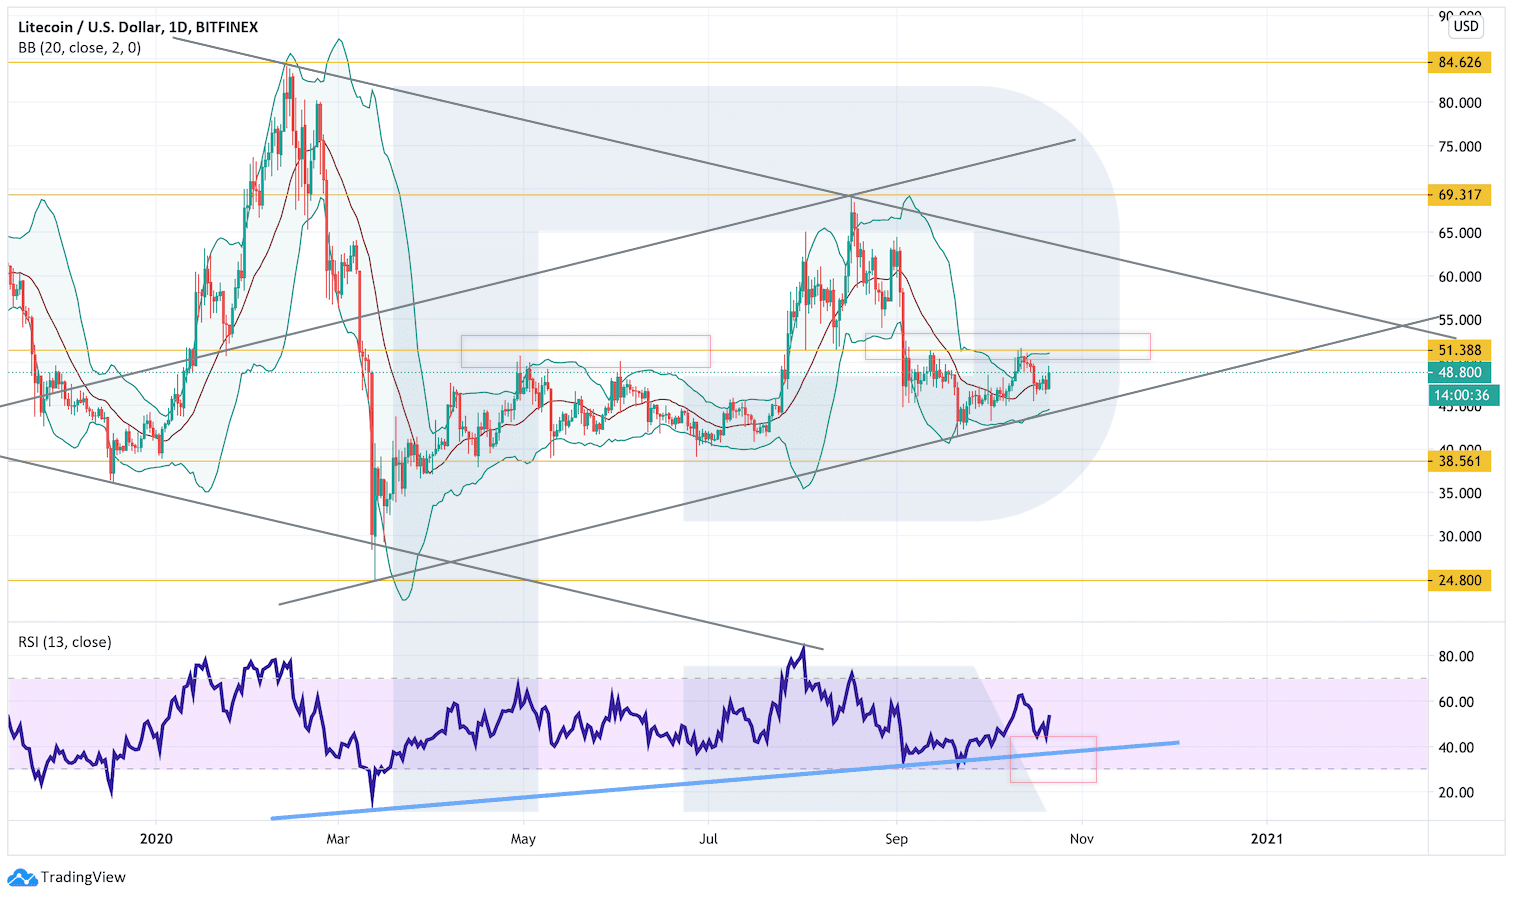
In the daily chart, Litecoin is still correcting and forming a Head & Shoulders reversal pattern. There are still risks of further decline and the pattern materialization if the price breaks the support area and fixes below $38.55. However, the main scenario implies that the market may try to break the resistance area and fix above $52. In this case, the pattern will be canceled and the asset may continue trading upwards with the target at $60.
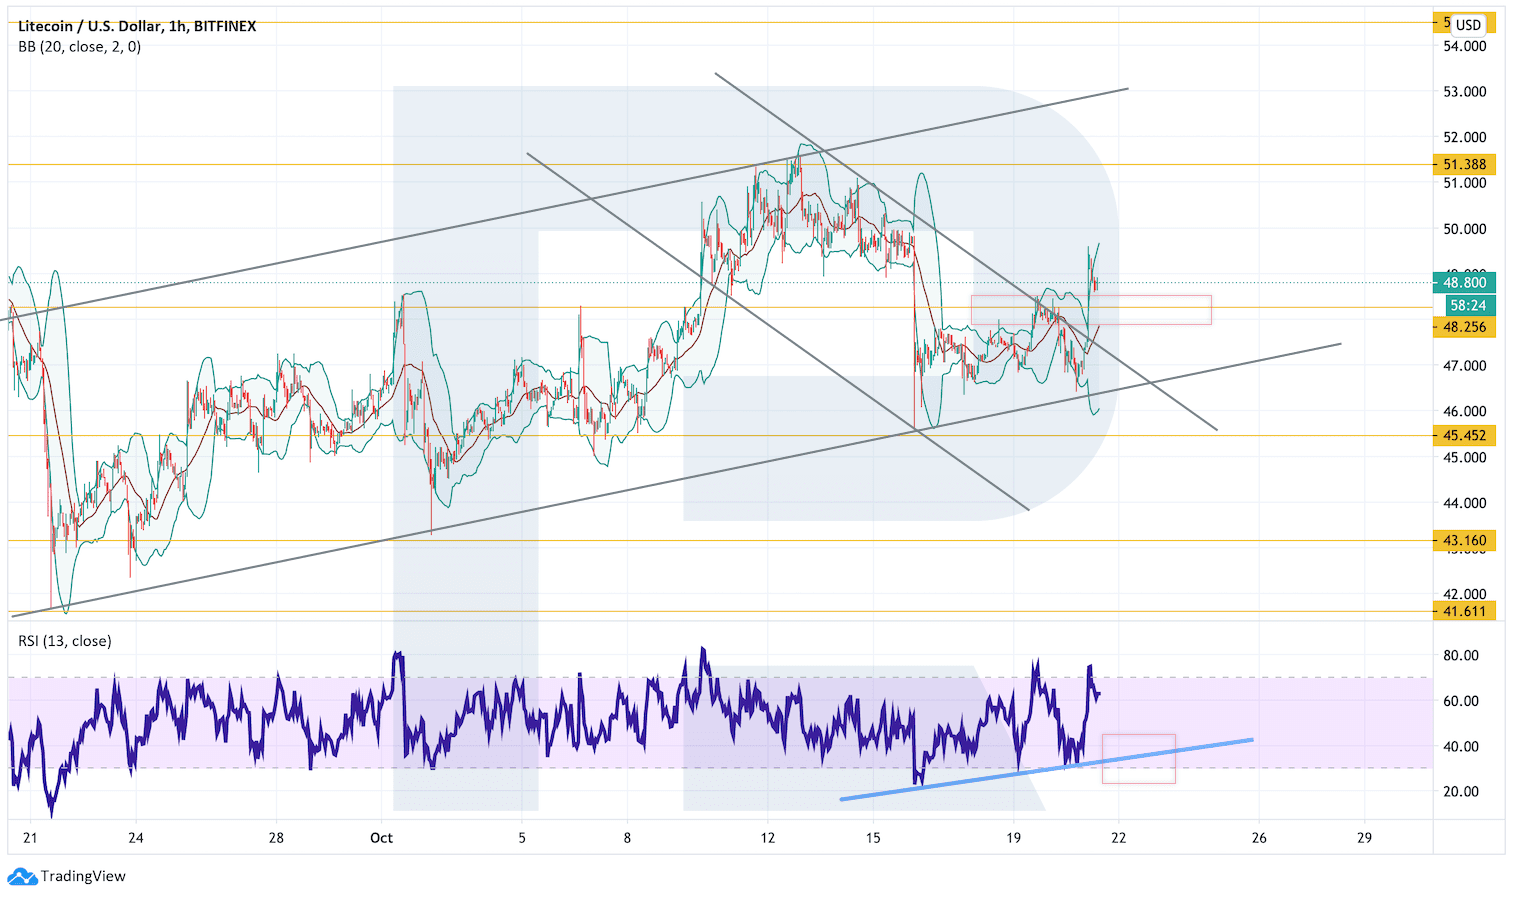
As we can see in the H4 chart, LTC/USD has broken the descending channel’s upside border. One shouldn’t exclude the possibility of a test of the broken border before further growth towards $51.40. A god signal in favor of this idea will be a rebound from the support line at the RSI. However, this bullish scenario may no longer be valid if the market breaks the rising channel’s downside border and fixes below $45.45. After that, the instrument may continue falling to reach $41.60.
Bitcoin Cash
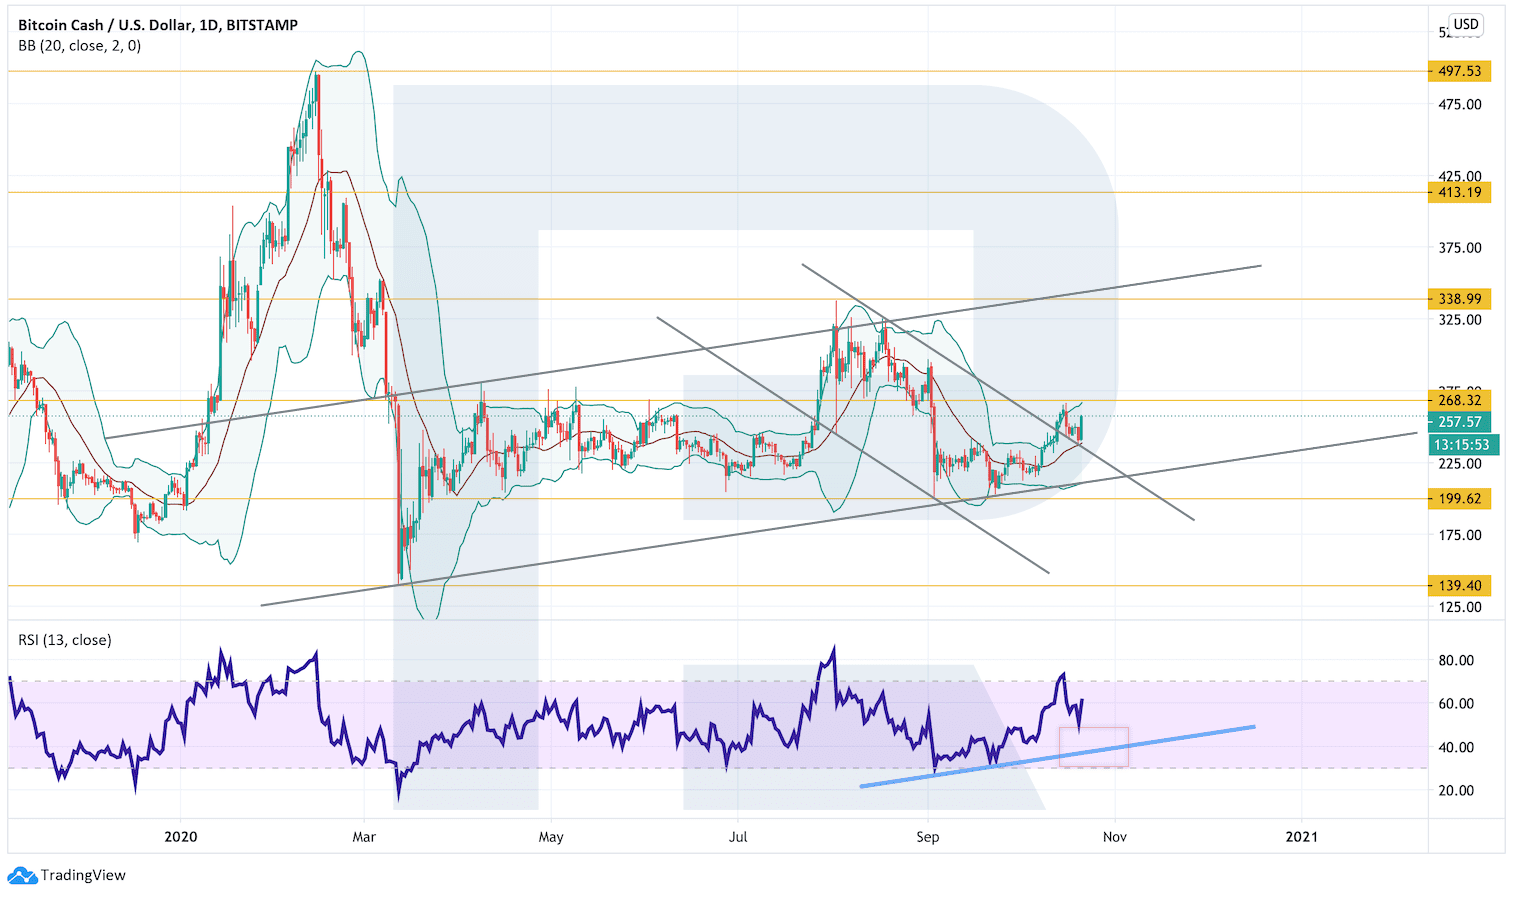
As we can see in the daily chart, Bitcoin Cash is no longer trading within the descending channel. There is a potential for further growth towards $338. To confirm this idea, the cryptocurrency must break the resistance area and fix above $268 – this level is a serious obstacle for bulls. However, this scenario may no longer be valid if the market breaks the rising channel’s downside border and fixes below $199. In this case, the instrument may continue falling with the target at $139.
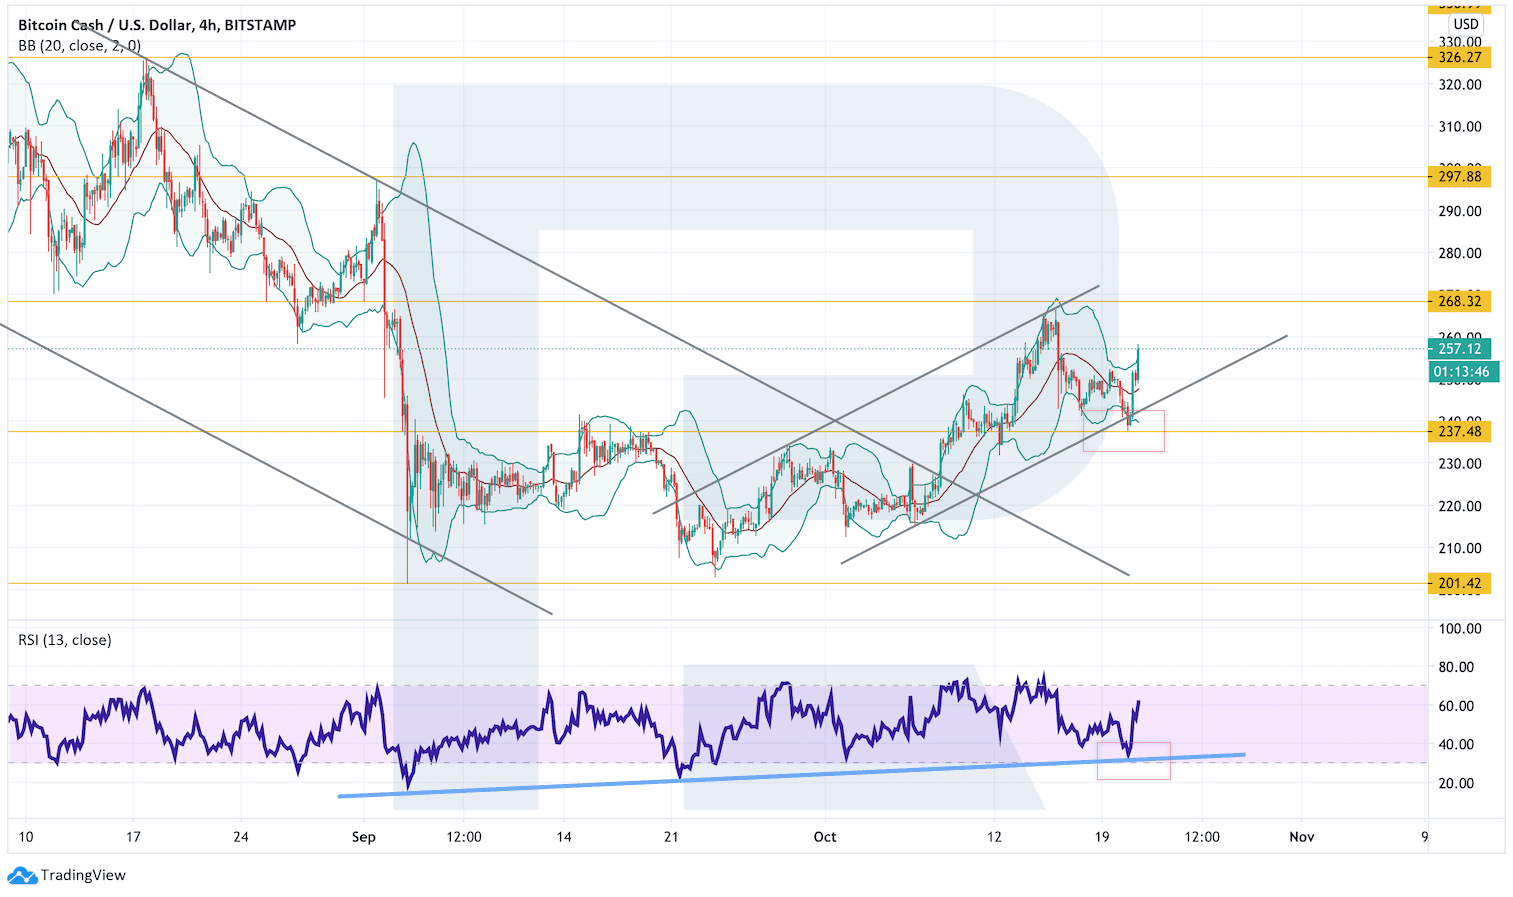
In the H4 chart, the asset has rebounded from the support area at $237. The closest upside target is at $268. A strong signal in favor of further growth is a rebound from the support line at the RSI. Still, this scenario may be canceled if the market breaks the rising channel’s downside border and fixes below $237. After that, the instrument may continue moving downwards to reach $201.
TRON
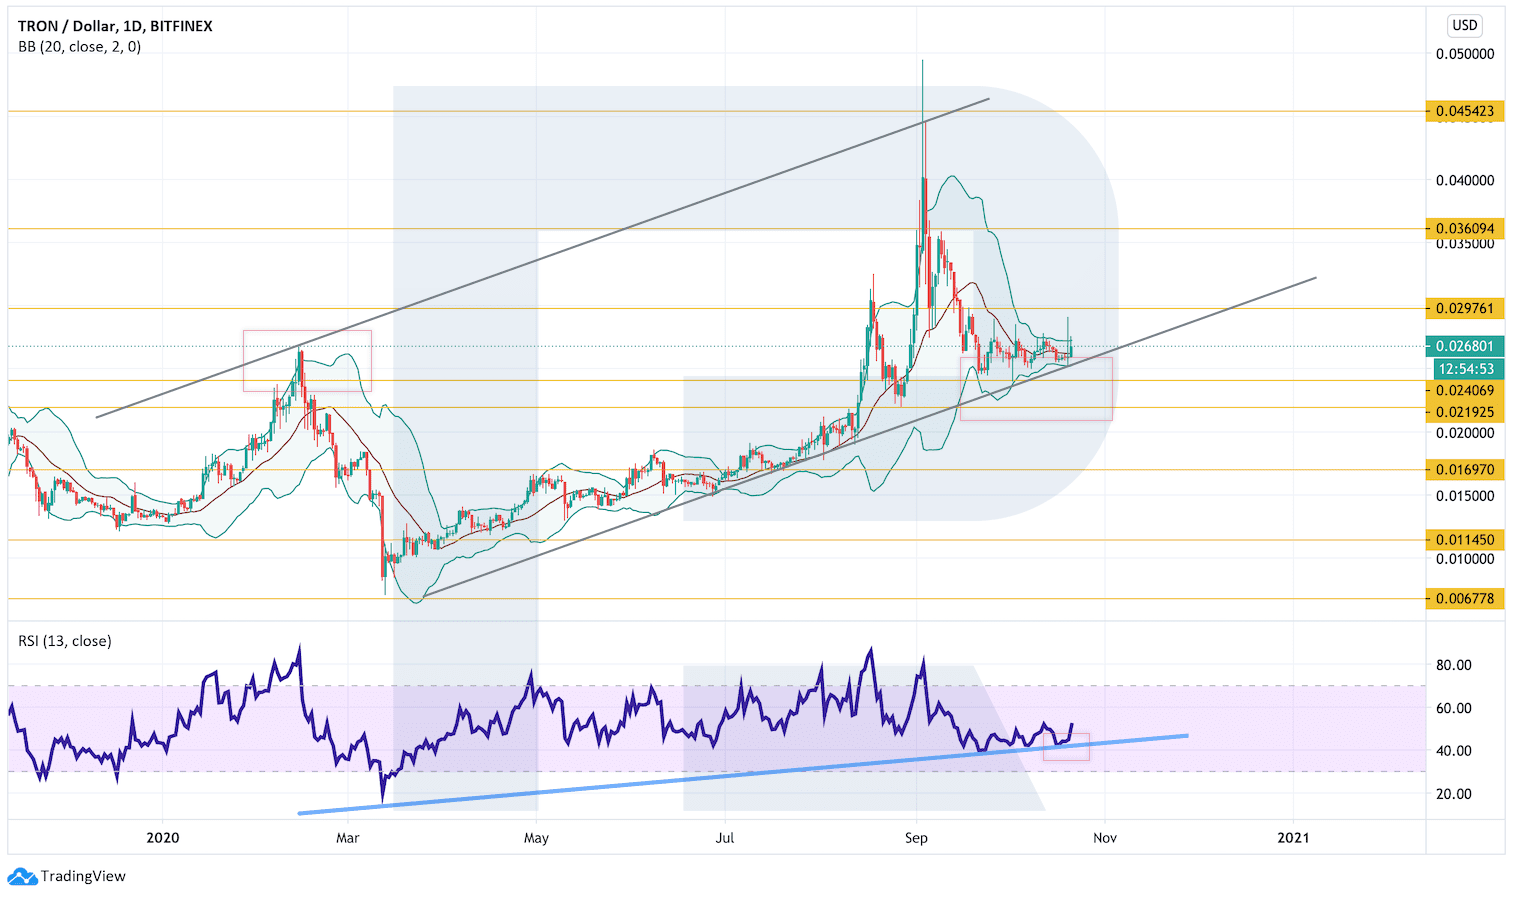
In the daily chart, TRON continues moving within the rising channel and forming a “5-0” pattern. The RSI has once again rebounded from the support line and there are chances to see further growth with the first target at $.0.036. To confirm this idea, the asset must break the resistance rea and fix above $0.029. However, this scenario may no longer be valid if the market breaks the rising channel’s downside border and fixes below $0.021. In this case, the instrument may continue falling to reach $0.016.
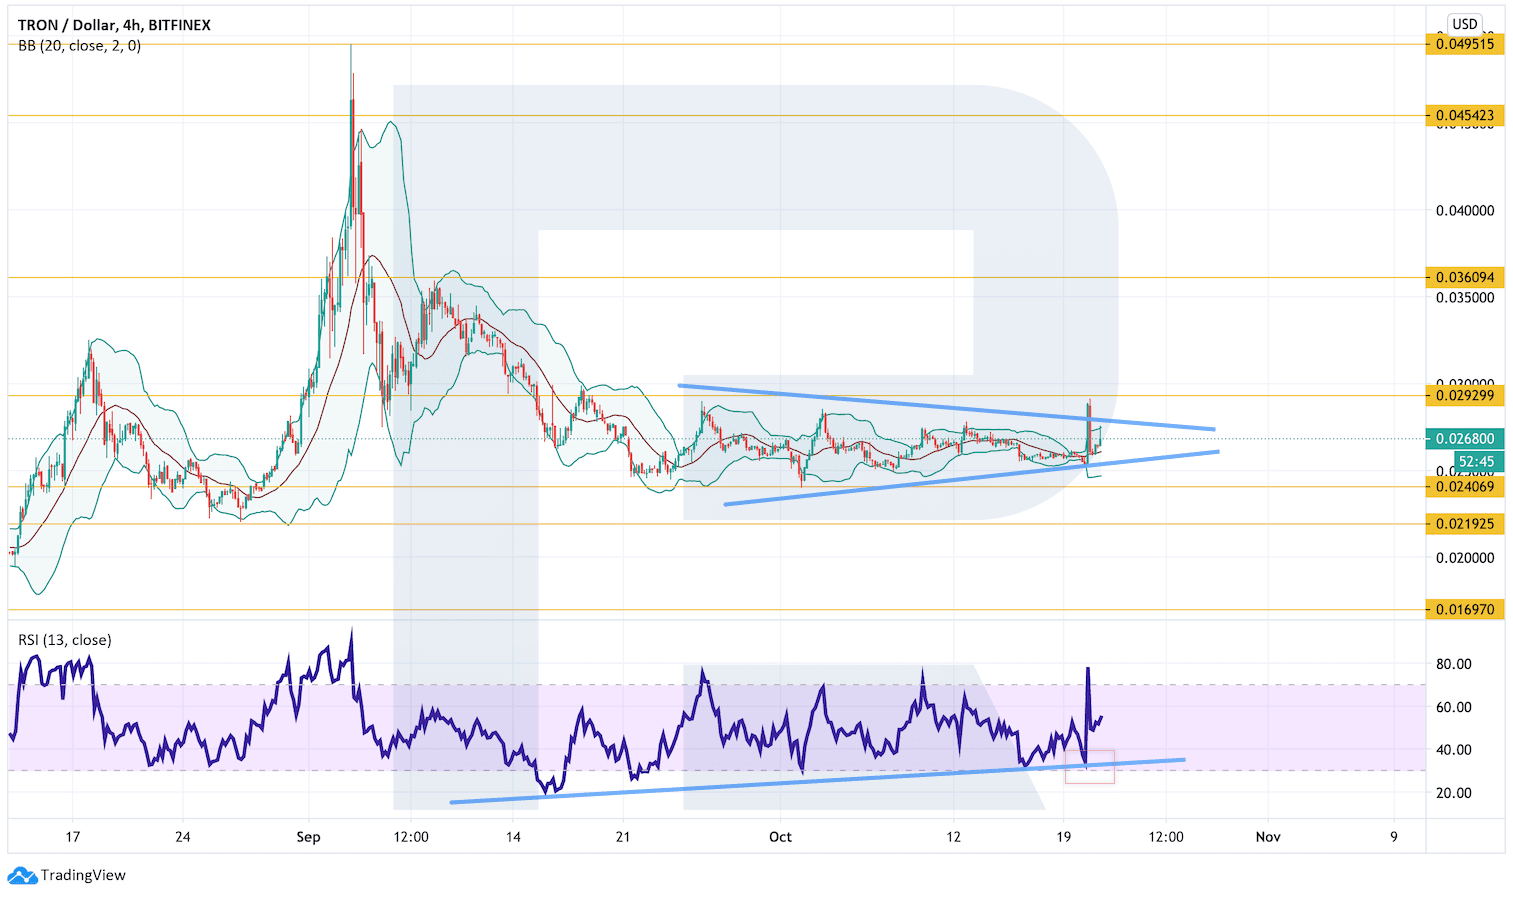
On shorter timeframes, the cryptocurrency is forming a Triangle pattern. Bulls tried to break the pattern’s upside border but have failed to fix the price above the resistance area so far. Only after breaking this border, the asset may start a proper growth towards $0.036. another signal in favor of this idea will be a rebound from the support line at the RSI – as one can see, each test of this line leads to further growth. Still, this scenario may be canceled if the market breaks the pattern’s downside border and fixes below $0.024. After that, the instrument may continue trading downwards with the target at $0.016.
By Dmitriy Gurkovskiy, Chief Analyst at RoboForex
Disclaimer
Any predictions contained herein are based on the author's particular opinion. This analysis shall not be treated as trading advice. RoboForex shall not be held liable for the results of the trades arising from relying upon trading recommendations and reviews contained herein.
© 2020 CryptoDaily All Rights Reserved. This article is provided for informational purposes only. It is not offered or intended to be used as legal, tax, investment, financial, or other advice.

Related Stories