Bitcoin (BTC/USD) staged a recovery early in today’s Asian session as the pair again approached the 10700 level after trading as low as the 10524.00 area during yesterday’s Asian session. Traders took the pair as high as the 10683.75 level during yesterday’s North American session, a test of the 10685.51 level that represents the 38.2% retracement of the recent depreciating range from 12086.00 to 9819.83. Traders are paying close attention to some upside retracement levels including the 10697.05, 10714.92, 10797.88, and 10810.38 areas. Other additional technically significant areas include the 10657.56, 10700.03, 10933.36, and 10956.34 levels. Market sentiment appears to continue to favour an appreciating BTC/USD, and stronger long positions will carefully monitor price activity around the 10685.51 and 10952.92 levels. Below current market activity, traders are carefully monitoring important levels including the 10580.82, 10530.40, 10497.86, 10466.71, and 10457.12 areas. Chartists are observing that the 100-hour simple moving average is bullishly converging with the 200-hour simple moving average. Stops were recently elected below the 11120, 11004.10, 10961.41, 10647.72, 10546.15, and 10450.26 areas during the recent depreciation from recent multi-week highs.
Traders note that the recent high of 12486.61 represented a test of the 12496.68 area, an upside price objective related to buying pressure that emerged around the 8055.91 area earlier this year. Traders also remain focused on the 12023.45, 11964.56, 11880.38, 11803.31, 11737.30, 11642.95, 11560.28, and 11533.51 areas during pullbacks higher, representing the retracements of the recent appreciating ranges that commenced around the 9005.00, 8905.84, 8815.01, and 8632.93 areas. Other important technical levels include the 11510.44 area, representing the 50% retracement of a historical depreciation from 19891.99 to 3128.89, as well as the 10200.39, 10139.11, and 10082.97 areas. Chartists are observing that the 50-bar MA (4-hourly) is bullishly indicating above the 100-bar MA (4-hourly) and above the 200-bar MA (4-hourly). Also, the 50-bar MA (hourly) is bullishly indicating above the 100-bar MA (hourly) and above the 200-bar MA (hourly).
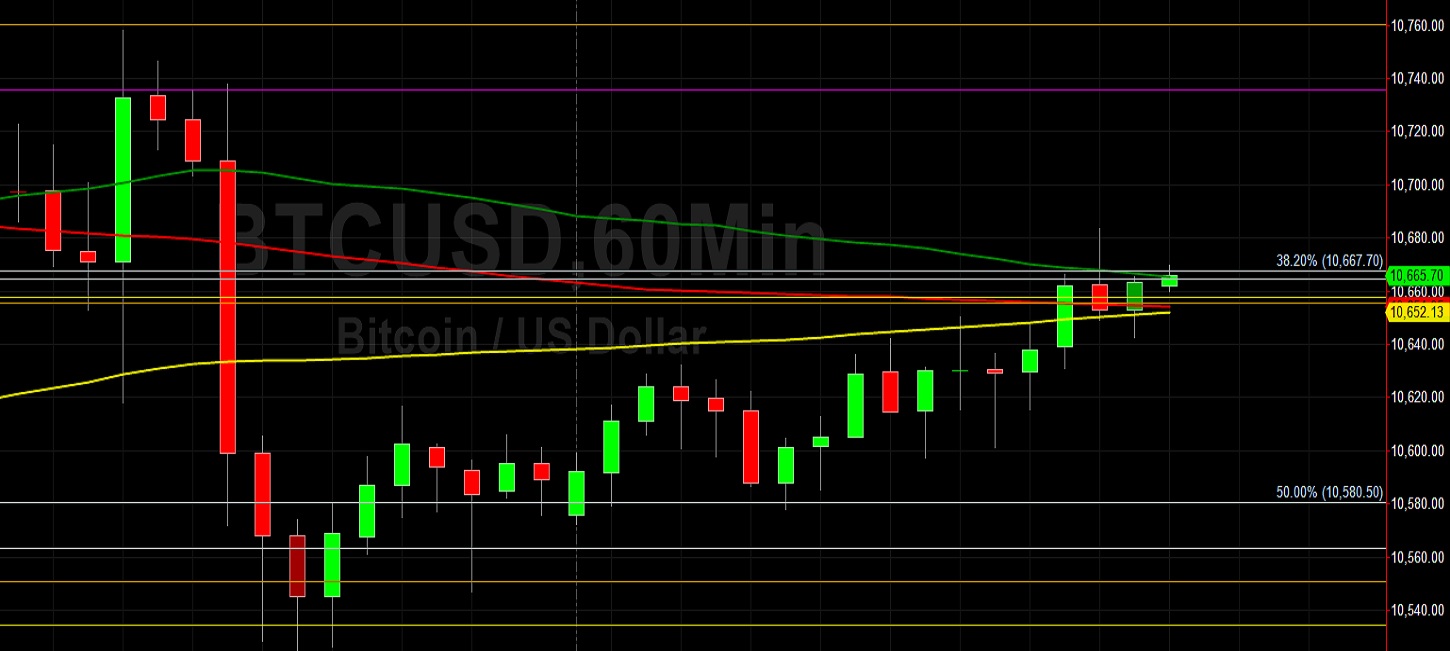
Price activity is nearest the 50-bar MA (4-hourly) at 10656.07 and the 50-bar MA (Hourly) at 10665.38.
Technical Support is expected around 10135.22/ 9816.32/ 9861.42 with Stops expected below.
Technical Resistance is expected around 11179.90/ 11496.70/ 11601.04 with Stops expected above.
On 4-Hourly chart, SlowK is Bullishly above SlowD while MACD is Bearishly below MACDAverage.
On 60-minute chart, SlowK is Bearishly below SlowD while MACD is Bullishly above MACDAverage.