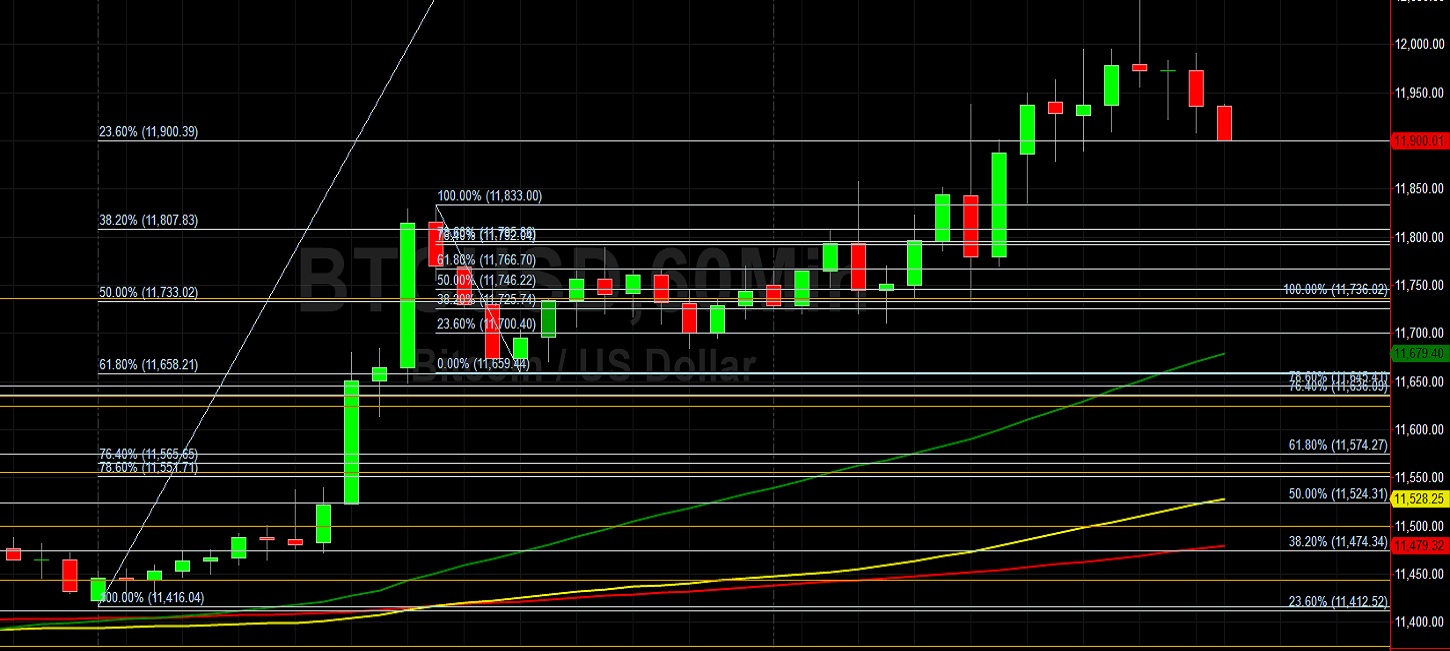
Bitcoin (BTC/USD) gave back some gains in today’s North American session as the pair receded to the 11908.49 area after trading as high as the 12050 area earlier in the North American session, a test of the 12060.06 area that represents the 61.8% retracement of the depreciating range from 12486.61 to 11370.00. The 11700.40 area emerged as important technical support during the Asian session, right around the 23.6% retracement of the recent depreciating range from 11833 to 11659.44. Stops were elected above the some key technical levels during the acute move higher including the 11928.31, 11957.97, and 11992.15 areas. Above current price activity, upside price objectives include the 12112.97, 12173.80, and 12348.26 levels. Traders continue to carefully monitor market demand around the 11282.19 area, representing the 23.6% retracement of the appreciating range from 9813.00 to 11736.02.
Traders note that the recent high of 12486.61 represented a test of the 12496.68 area, an upside price objective related to buying pressure that emerged around the 8055.91 area earlier this year. Traders also remain focused on the 12023.45, 11964.56, 11880.38, 11803.31, 11737.30, 11642.95, 11560.28, and 11533.51 areas during pullbacks higher, representing the retracements of the recent appreciating ranges that commenced around the 9005.00, 8905.84, 8815.01, and 8632.93 areas. Other important technical levels include the 11510.44 area, representing the 50% retracement of a historical depreciation from 19891.99 to 3128.89, as well as the 10200.39, 10139.11, and 10082.97 areas. Chartists are observing that the 50-bar MA (4-hourly) is bullishly indicating above the 100-bar MA (4-hourly) and above the 200-bar MA (4-hourly). Also, the 50-bar MA (hourly) is bullishly indicating above the 100-bar MA (hourly) and above the 200-bar MA (hourly).
Price activity is nearest the 50-bar MA (4-hourly) at 11484.97 and the 50-bar MA (Hourly) at 11679.52.
Technical Support is expected around 10610.94/ 10459.89/ 10135.22 with Stops expected below.
Technical Resistance is expected around 12086.00/ 12348.26/ 12486.61 with Stops expected above.
On 4-Hourly chart, SlowK is Bullishly above SlowD while MACD is Bullishly above MACDAverage.
On 60-minute chart, SlowK is Bearishly below SlowD while MACD is Bearishly below MACDAverage.