Bitcoin (BTC/USD) continued its approach of the 11000 figure early in today’s Asian session as the pair maintained its upward bias following its ascent to the 10800 area during yesterday’s Asian session. Profit-taking emerged and knocked BTC/USD lower to the 10650.00 area after Stops were elected below the 10697.05 area, representing the 23.6% retracement of the recent appreciating range from 10363.76 to 10800. The pullback also represented a test of the 10647.87 area, representing the 50% retracement of the wider depreciating range from 10931.38 to 10363.76. Additional retracement levels in this depreciating range include 10580.82 and 10497.86, and additional retracement levels in the more recent appreciating range include 10633.36, 10581.88, 10530.40, 10466.71, and 10457.12. Chartists are observing that the 50-hour simple moving average has bullishly moved above the 200-hour simple moving average. Stops were recently elected below the 11120, 11004.10, 10961.41, 10647.72, 10546.15, and 10450.26 areas during the recent depreciation from recent multi-week highs.
Traders note that the recent high of 12486.61 represented a test of the 12496.68 area, an upside price objective related to buying pressure that emerged around the 8055.91 area earlier this year. Traders also remain focused on the 12023.45, 11964.56, 11880.38, 11803.31, 11737.30, 11642.95, 11560.28, and 11533.51 areas during pullbacks higher, representing the retracements of the recent appreciating ranges that commenced around the 9005.00, 8905.84, 8815.01, and 8632.93 areas. Other important technical levels include the 11510.44 area, representing the 50% retracement of a historical depreciation from 19891.99 to 3128.89, as well as the 10200.39, 10139.11, and 10082.97 areas. Chartists are observing that the 50-bar MA (4-hourly) is bullishly indicating above the 100-bar MA (4-hourly) and above the 200-bar MA (4-hourly). Also, the 50-bar MA (hourly) is bullishly indicating above the 100-bar MA (hourly) and above the 200-bar MA (hourly).
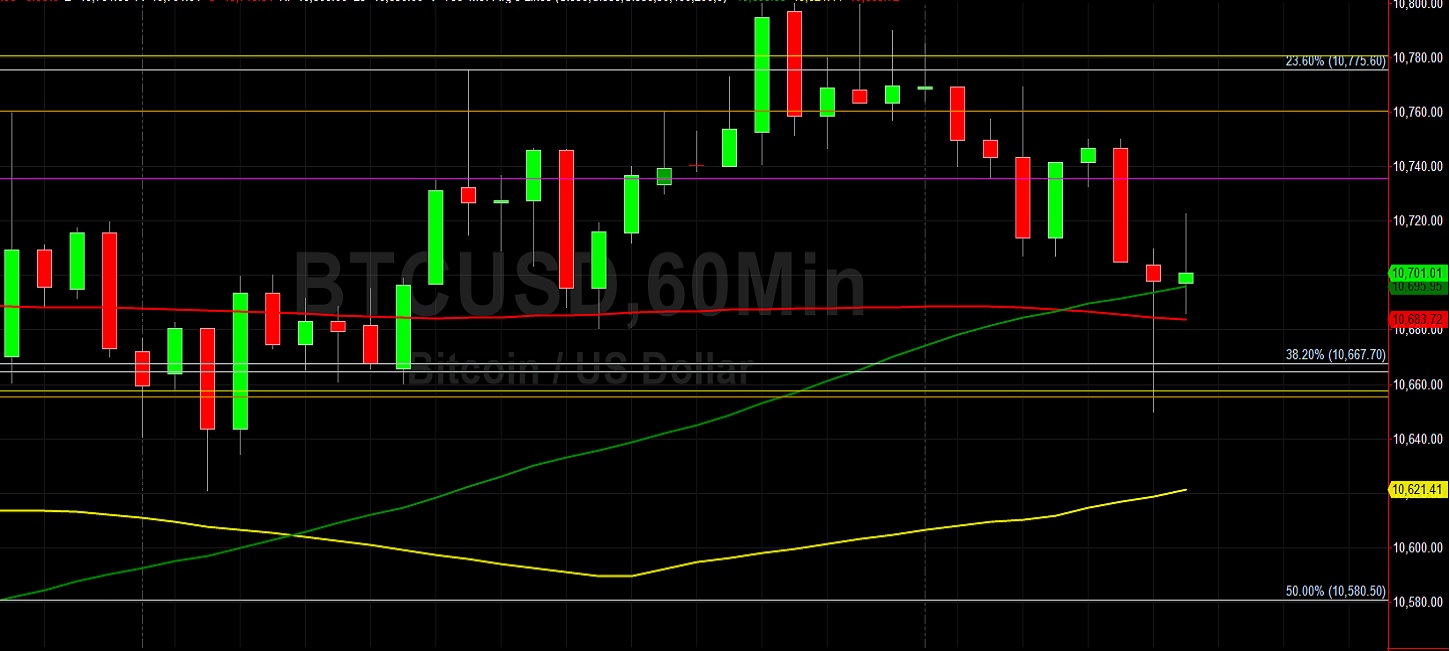
Price activity is nearest the 50-bar MA (4-hourly) at 10681.67 and the 50-bar MA (Hourly) at 10696.02.
Technical Support is expected around 10135.22/ 9816.32/ 9861.42 with Stops expected below.
Technical Resistance is expected around 11179.90/ 11496.70/ 11601.04 with Stops expected above.
On 4-Hourly chart, SlowK is Bearishly below SlowD while MACD is Bullishly above MACDAverage.
On 60-minute chart, SlowK is Bearishly below SlowD while MACD is Bearishly below MACDAverage.