Bitcoin (BTC/USD) extended recent gains early in today’s North American session as the pair appreciated to the 12450 level after trading as low as the 12141 area during the European session, a level that is now just below the 38.2% retracement of the subsequent appreciating range from 11659.44 to 12450.00. Traders are noting that the 12205.99 area emerged as an important one during the North American session where upside demand emerged, a level that now represents the 23.6% retracement of the broader appreciating range from 11416.04 to 12450.00. BTC/USD experienced a sharp appreciation during the Asian session when it climbed from the 11876.51 area to the 12322.81 area. Following the pair’s recent ascent, traders are paying close attention to potential areas of technical support during pullbacks and these include the 12230.93, 12205.99, 12163.26, 12055.03, 12095.58, 11933.02, 11811.01, and 11660.05 areas. Stops were recently elected above many additional upside price objectives including the 11120, 11179.90, 11272.86, 11378.11, 11409.40, and 11489.10 levels en route to multi-week highs.
Traders note that the recent high of 12486.61 represented a test of the 12496.68 area, an upside price objective related to buying pressure that emerged around the 8055.91 area earlier this year. Traders also remain focused on the 12023.45, 11964.56, 11880.38, 11803.31, 11737.30, 11642.95, 11560.28, and 11533.51 areas during pullbacks higher, representing the retracements of the recent appreciating ranges that commenced around the 9005.00, 8905.84, 8815.01, and 8632.93 areas. Other important technical levels include the 11510.44 area, representing the 50% retracement of a historical depreciation from 19891.99 to 3128.89, as well as the 10200.39, 10139.11, and 10082.97 areas. Chartists are observing that the 50-bar MA (4-hourly) is bullishly indicating above the 100-bar MA (4-hourly) and above the 200-bar MA (4-hourly). Also, the 50-bar MA (hourly) is bullishly indicating above the 100-bar MA (hourly) and above the 200-bar MA (hourly).
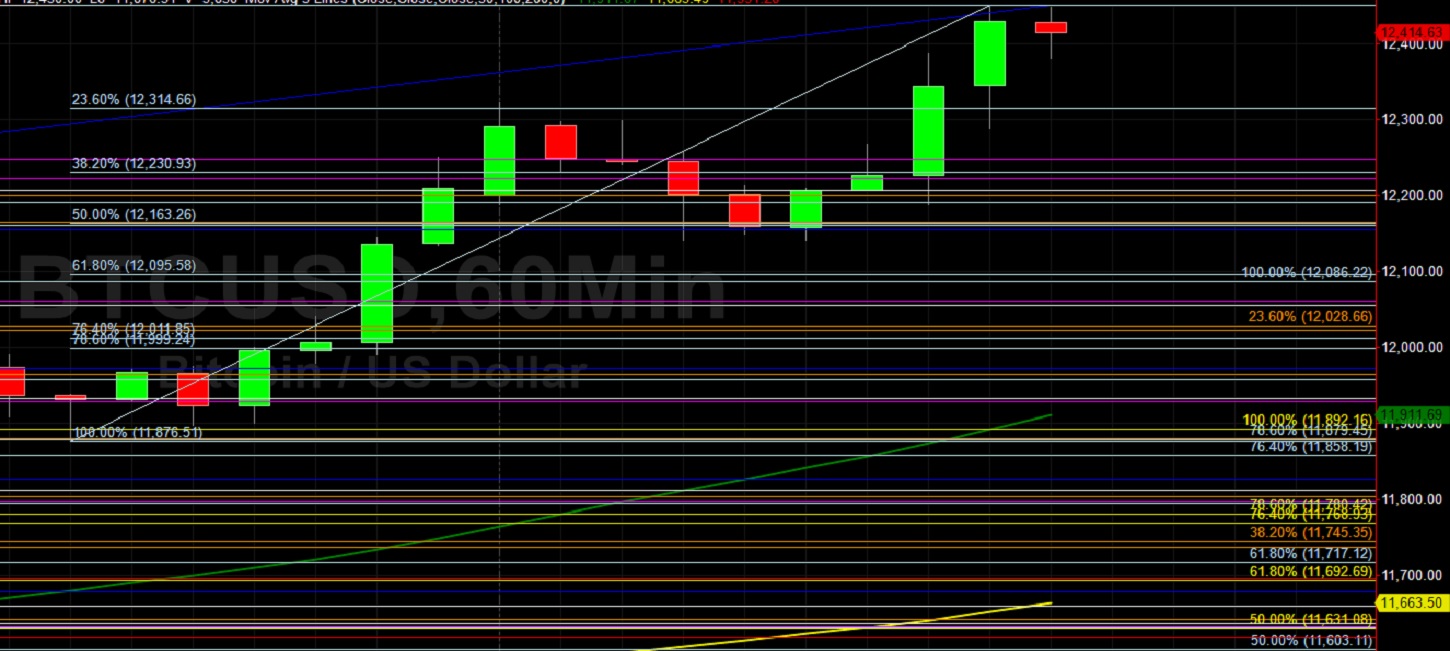
Price activity is nearest the 50-bar MA (4-hourly) at 11548.69 and the 50-bar MA (Hourly) at 11911.64.
Technical Support is expected around 12055.03/ 11933.02/ 11811.01 with Stops expected below.
Technical Resistance is expected around 12486.61/ 12713.18/ 13202.63 with Stops expected above.
On 4-Hourly chart, SlowK is Bullishly above SlowD while MACD is Bullishly above MACDAverage.
On 60-minute chart, SlowK is Bullishly above SlowD while MACD is Bullishly above MACDAverage.