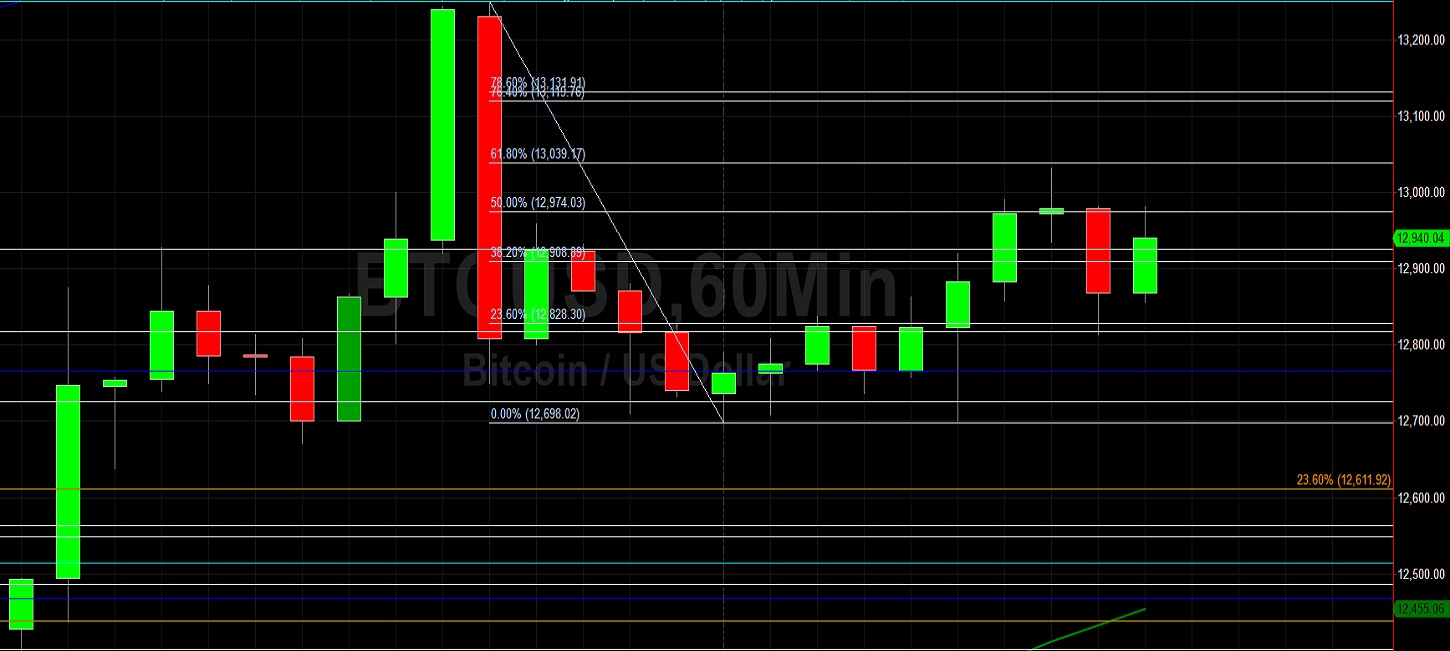
Bitcoin (BTC/USD) continued its climb early in today’s North American session as the pair appreciated to the 12935.04 level after trading as low as the 12670.76 area during the Asian session. The pair had earlier traded as high as the 13250.04 area during the Asian session, its strongest print since June 2019. Chartists are noting that the pair ran out of steam around the 13032.44 area during the European session, just below the 13099.17 area that represents the 61.8% retracement of the recent depreciating range from 13250.04 to 12698.02. Additional upside levels in this depreciating range include the 13119.76 and 13131.91 areas. Above current price activity, traders are closely watching the 13488.49 and 13884.29 levels.
Following the pair’s recent ascent, traders are paying close attention to potential areas of technical support during pullbacks and these include the 12925.89, 12817.22, 12766.47, 12611.92, 12549.45, 12514.94, 12438.90, 12060.18, 11937.09, 11692.63, and 11531.52 areas. Stops were recently elected above many additional upside price objectives including the 11120, 11179.90, 11272.86, 11378.11, 11409.40, 11489.10, 11857.25, 11915.92, and 12023.45 levels. Another important technical level includes the 11510.44 area, representing the 50% retracement of a historical depreciation from 19891.99 to 3128.89, as well as the 10200.39, 10139.11, and 10082.97 areas. Chartists are observing that the 50-bar MA (4-hourly) is bullishly indicating above the 100-bar MA (4-hourly) and above the 200-bar MA (4-hourly). Also, the 50-bar MA (hourly) is bullishly indicating above the 100-bar MA (hourly) and above the 200-bar MA (hourly).
Price activity is nearest the 50-bar MA (4-hourly) at 11724.00 and the 50-bar MA (Hourly) at 12455.94.
Technical Support is expected around 12055.03/ 11933.02/ 11811.01 with Stops expected below.
Technical Resistance is expected around 13250.04/ 13488.49/ 13868.44 with Stops expected above.
On 4-Hourly chart, SlowK is Bullishly above SlowD while MACD is Bullishly above MACDAverage.
On 60-minute chart, SlowK is Bullishly above SlowD while MACD is Bearishly below MACDAverage.