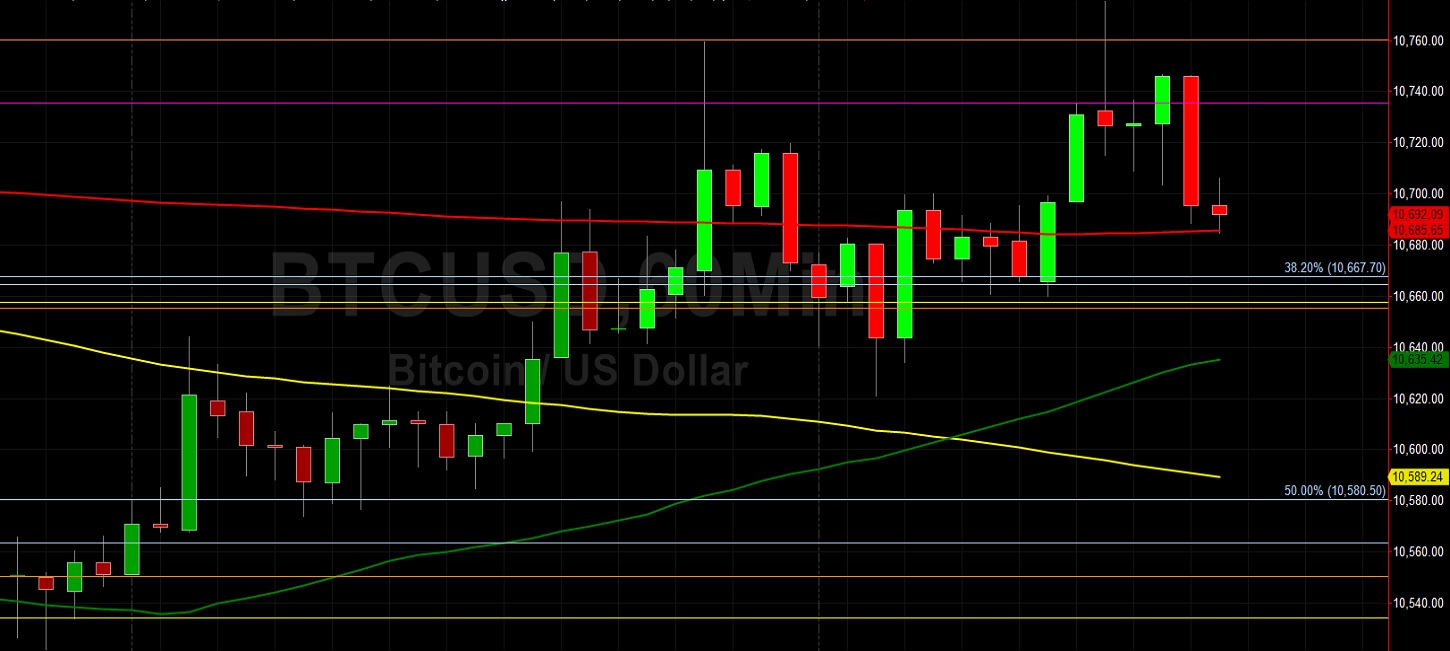
Bitcoin (BTC/USD) added to recent gains early in today’s Asian session as traders continued to accumulate above the 10500 level following the pair’s recent low around the 10363.76 area, representing a test of the 38.2% retracement of the historical appreciating range from 4680.65 to 13878.40. Traders pushed BTC/USD as high as the 10775.26 area during yesterday’s North American session before some profit-taking ensued. The pair encountered some technical resistance around the 10759.62 area earlier this week, representing a test of the 38.2% retracement of the recent appreciating range from 10211.00 to 11099.95. Chartists are noting that technical resistance emerged around the 10735 area during yesterday’s North American session, right around a level that represented technical support in mid-September after a depreciation from the 11099.95 area. Chartists are observing that the 50-bar 4-hourly simple moving average has bullishly moved above the 100-bar 4-hourly simple moving average, and that the 50-hour simple moving average has bullishly moved above the 100-hour simple moving average. Stops were recently elected below the 11120, 11004.10, 10961.41, 10647.72, 10546.15, and 10450.26 areas during the recent depreciation from recent multi-week highs.
Traders note that the recent high of 12486.61 represented a test of the 12496.68 area, an upside price objective related to buying pressure that emerged around the 8055.91 area earlier this year. Traders also remain focused on the 12023.45, 11964.56, 11880.38, 11803.31, 11737.30, 11642.95, 11560.28, and 11533.51 areas during pullbacks higher, representing the retracements of the recent appreciating ranges that commenced around the 9005.00, 8905.84, 8815.01, and 8632.93 areas. Other important technical levels include the 11510.44 area, representing the 50% retracement of a historical depreciation from 19891.99 to 3128.89, as well as the 10200.39, 10139.11, and 10082.97 areas. Chartists are observing that the 50-bar MA (4-hourly) is bullishly indicating above the 100-bar MA (4-hourly) and above the 200-bar MA (4-hourly). Also, the 50-bar MA (hourly) is bearishly indicating below the 200-bar MA (hourly) and above the 100-bar MA (hourly).
Price activity is nearest the 50-bar MA (4-hourly) at 10685.79 and the 200-bar MA (Hourly) at 10684.08.
Technical Support is expected around 10135.22/ 9816.32/ 9861.42 with Stops expected below.
Technical Resistance is expected around 11179.90/ 11496.70/ 11601.04 with Stops expected above.
On 4-Hourly chart, SlowK is Bullishly above SlowD while MACD is Bullishly above MACDAverage.
On 60-minute chart, SlowK is Bullishly above SlowD while MACD is Bearishly below MACDAverage.