Bitcoin (BTC/USD) exploded higher early in today’s North American session as the pair appreciated to the 13498.24 level after trading as low as the 13000.00 figure in the Asian session, its strongest print this year. Stops were elected above the 13361.00 level during the pair’s ascent, a recent relative high, and strong upward pressure has kept the pair bid from the 12785.00 area. Traders are continuing to monitor the 13488.49 area, representing the 61.8% retracement of a broad historical depreciating range from 19891.99 to 3128.89. Above that area, traders anticipate some technical resistance between the 13868 and 13884 areas. Stops were recently elected above the 13117.18 area, a level that represents the 38.2% retracement of the recent appreciating range from 12722.72 to 13361.00. Additional downside retracement levels in this range around the 12816.49 and 12805.44 areas. Buying pressure recently emerged around the 12865 area, just below the 12872.93 area that represents the 61.8% retracement of the recent appreciating range from 12670.67 to 13200. Another appreciating range that traders are monitoring is the ascent from 12698.02 to 13200.00. A couple of additional appreciating ranges that chartists are watching include the climb from 11201 to 13250.04, and the run-up from 11416.04 to 13250.04.
The 12766.47 and 12817.22 areas are significant potential areas of short-term technical support related to those appreciating ranges. Following the pair’s recent ascent, traders are paying close attention to potential areas of technical support during pullbacks and these include the 12925.89, 12817.22, 12766.47, 12611.92, 12549.45, 12514.94, 12438.90, 12060.18, 11937.09, 11692.63, and 11531.52 areas. Stops were recently elected above many additional upside price objectives including the 11120, 11179.90, 11272.86, 11378.11, 11409.40, 11489.10, 11857.25, 11915.92, and 12023.45 levels. Another important technical level includes the 11510.44 area, representing the 50% retracement of a historical depreciation from 19891.99 to 3128.89, as well as the 10200.39, 10139.11, and 10082.97 areas. Chartists are observing that the 50-bar MA (4-hourly) is bullishly indicating above the 100-bar MA (4-hourly) and above the 200-bar MA (4-hourly). Also, the 50-bar MA (hourly) is bullishly indicating above the 100-bar MA (hourly) and above the 200-bar MA (hourly).
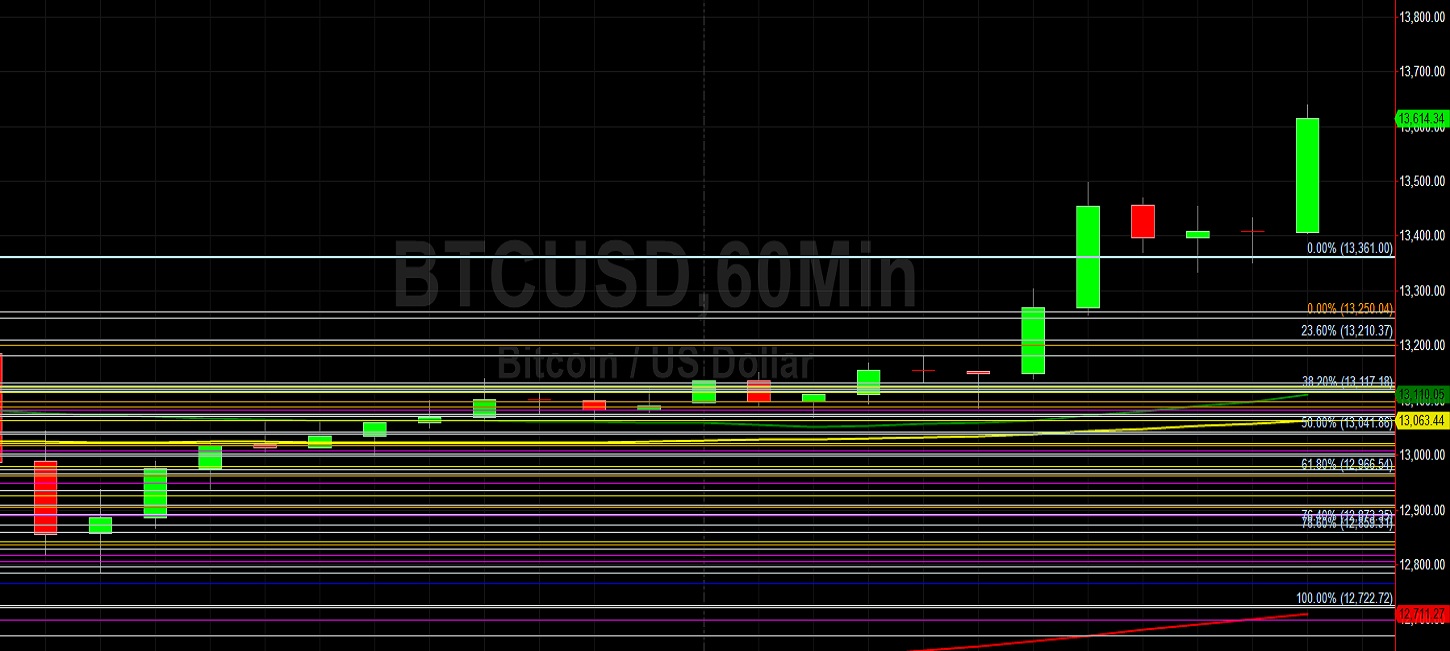
Price activity is nearest the 50-bar MA (4-hourly) at 12726.20 and the 50-bar MA (Hourly) at 13109.30.
Technical Support is expected around 13260.30/ 13038.35/ 12772.83 with Stops expected below.
Technical Resistance is expected around 13694.57/ 14000.81/ 14052.39 with Stops expected above.
On 4-Hourly chart, SlowK is Bullishly above SlowD while MACD is Bullishly above MACDAverage.
On 60-minute chart, SlowK is Bullishly above SlowD while MACD is Bullishly above MACDAverage.