Bitcoin (BTC/USD) attempted to sustain its recent break above the 11000 figure early in today’s Asian session as the pair sought to get above the 11111.11 area where it encountered resistance during yesterday’s North American session. Some Stops were elected above the 11099.95 area during the pair’s move higher, a recent relative high, and the recent appreciation opens up upside price objectives including the 11220.32, 11272.86, 11391.36, 11510.44, and 11604.29 areas. Additional Stops were reached above the 10657.56, 10700.03, 10933.36, and 10956.34 levels. Market sentiment appears to continue to favour an appreciating BTC/USD. Below current market activity, traders are carefully monitoring important levels including the 10530.40, 10497.86, 10466.71, and 10457.12 areas. Chartists are observing that the 50-bar 4-hourly simple moving average has bullishly bullishly moved below the 100-hour simple moving average.
Traders note that the recent high of 12486.61 represented a test of the 12496.68 area, an upside price objective related to buying pressure that emerged around the 8055.91 area earlier this year. Traders also remain focused on the 12023.45, 11964.56, 11880.38, 11803.31, 11737.30, 11642.95, 11560.28, and 11533.51 areas during pullbacks higher, representing the retracements of the recent appreciating ranges that commenced around the 9005.00, 8905.84, 8815.01, and 8632.93 areas. Other important technical levels include the 11510.44 area, representing the 50% retracement of a historical depreciation from 19891.99 to 3128.89, as well as the 10200.39, 10139.11, and 10082.97 areas. Chartists are observing that the 50-bar MA (4-hourly) is bullishly indicating above the 100-bar MA (4-hourly) and above the 200-bar MA (4-hourly). Also, the 50-bar MA (hourly) is bullishly indicating above the 100-bar MA (hourly) and above the 200-bar MA (hourly).
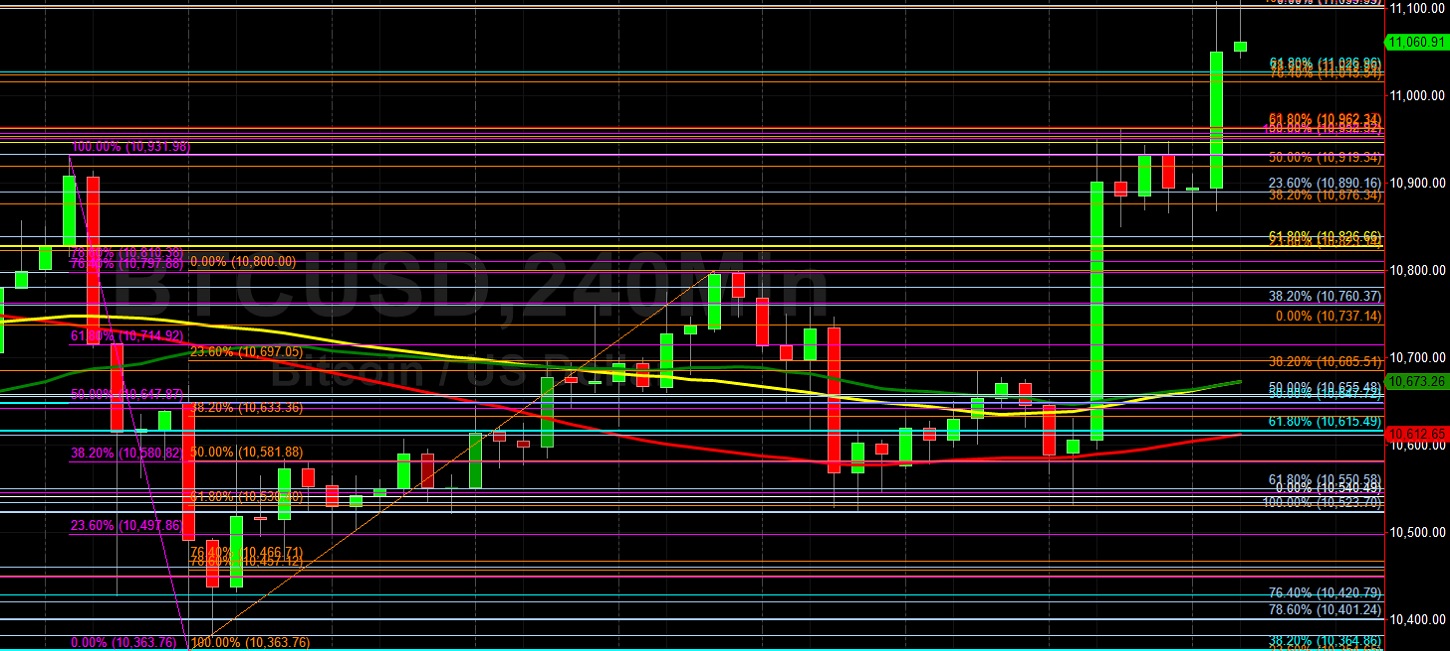
Price activity is nearest the 50-bar MA (4-hourly) at 10673.46 and the 50-bar MA (Hourly) at 10789.02.
Technical Support is expected around 10135.22/ 9816.32/ 9861.42 with Stops expected below.
Technical Resistance is expected around 11179.90/ 11496.70/ 11601.04 with Stops expected above.
On 4-Hourly chart, SlowK is Bullishly above SlowD while MACD is Bullishly above MACDAverage.
On 60-minute chart, SlowK is Bullishly above SlowD while MACD is Bullishly above MACDAverage.