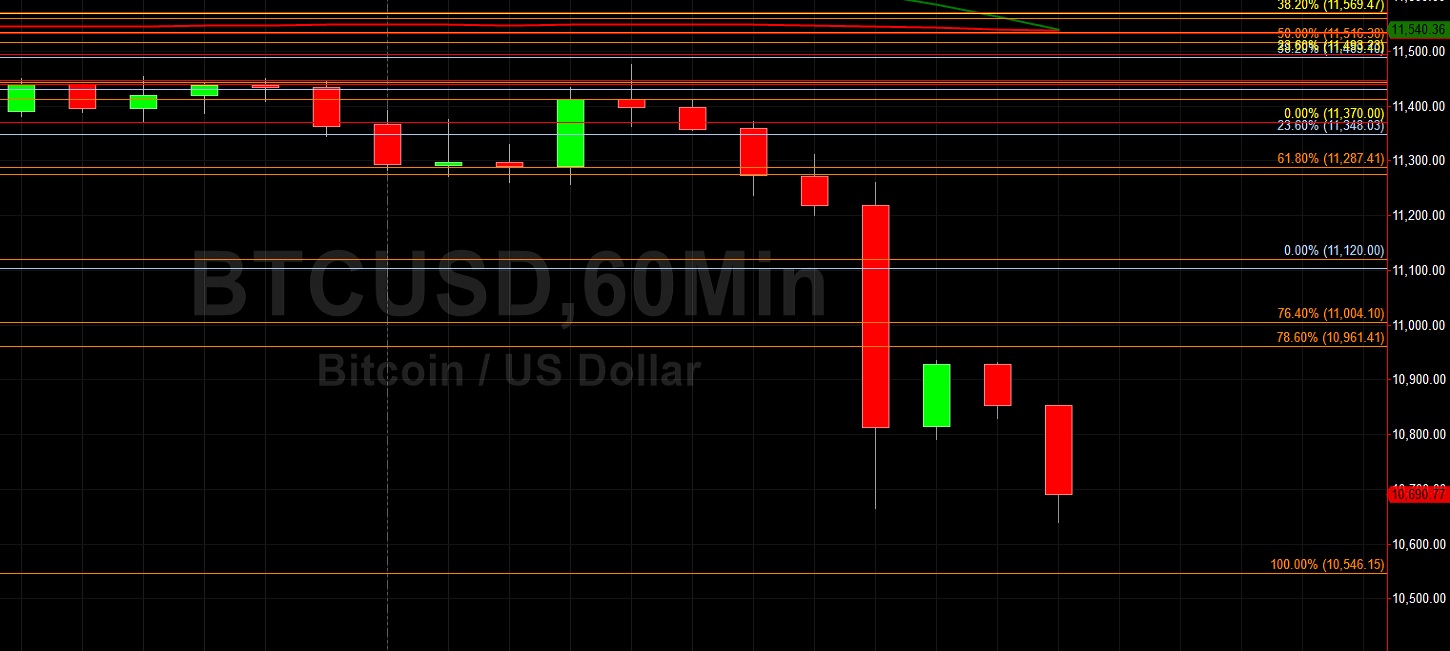
Bitcoin (BTC/USD) remained on the defensive early in today’s Asian session as the pair continued to trade below the 11000 figure following significant selling pressure that originated during yesterday’s European and North American sessions. The pair briefly retraced higher to the 11474.99 area during yesterday’s European session, a test of the 11489.10 area that represents the 38.2% retracement of the recent depreciation from 12086.22 to 11120.00. Stops were then elected below the 11120, 11004.10, and 10961.41 areas as the pair fell to 10639.64, a test of the 10647.72 area that represents the 50% retracement of the appreciating range from 7427 to 13868.44. Stops were recently elected below the 11710.39, 11594.37, 11478.34, and 11334.78 areas during the pullback, representing the 38.2%, 50%, 61.8%, and 76.4% retracements of the recent appreciating range from 11102.73 to 12086. During the pair’s recent pullback from multi-month highs, Stops were elected below the 11642.05, 11603.11, 11560.28, 11533.61, 11516.38, and 11442.52 areas, levels related to the pair’s appreciation to the 12486.61 area. Traders note that the recent high of 12486.61 represented a test of the 12496.68 area, an upside price objective related to buying pressure that emerged around the 8055.91 area earlier this year.
Traders also remain focused on the 12023.45, 11964.56, 11880.38, 11803.31, 11737.30, 11642.95, 11560.28, and 11533.51 areas during pullbacks lower, representing the retracements of the recent appreciating ranges that commenced around the 9005.00, 8905.84, 8815.01, and 8632.93 areas. A key level where buying pressure recently emerged is around the 11529.38 level, a test of the 11510.44 area that represents the 50% retracement of a historical depreciation from 19891.99 to 3128.89. Additional Stops were recently elected above the 11026.97, 11115.62, 11340.92, 11399.17, 11407.81, 11570.81, and 11761.97 levels. Below those areas, some potential areas of technical support include the 10200.39, 10139.11, and 10082.97 areas. Chartists are observing that the 50-bar MA (4-hourly) is bearishly indicating below the 100-bar MA (4-hourly) and below the 200-bar MA (4-hourly). Also, the 50-bar MA (hourly) is bearishly indicating below the 100-bar MA (hourly) and below the 200-bar MA (hourly).
Price activity is nearest the 50-bar MA (4-hourly) at 11536.79 and the 50-bar MA (Hourly) at 11539.72.
Technical Support is expected around 10615.49/ 10364.86/ 10149.22 with Stops expected below.
Technical Resistance is expected around 12496.68/ 12713.18/ 13202.63 with Stops expected above.
On 4-Hourly chart, SlowK is Bearishly below SlowD while MACD is Bearishly below MACDAverage.
On 60-minute chart, SlowK is Bearishly below SlowD while MACD is Bearishly below MACDAverage.