Ethereum (ETH/USD) encountered some upside activity early in today’s North American session as the pair appreciated to the 448.70 area after trading as low as the 420.58 area during the European session. Traders drove the pair as high as the 488.95 area during the Asian session after some Stops were elected above the 487.55 area, its first test of the psychologically-important 500.00 figure since July 2018. Stops were recently elected above the 474.59 area, an upside price objective that represents the 50% retracement of the historical depreciation from 828.97 to 80.60. Additional upside price objectives include the 498.68, 516.03, 517.38, 531.80, and 543.09 areas. The pair’s ongoing upward momentum was confirmed yesterday when buying pressure emerged around the 418.79 area during a pullback, representing the 61.8% retracement of the historical depreciation from 627.83 to 80.60.
Stops were elected below the 398.91, 397.08, 396.37, 392.67, 386.63, 384.29, and 382.47 areas during the pair’s recent depreciation from the 447.50 area, and traders are curious to see if these levels provide any technical support during pullbacks. The 396.69 area remains an important technical level, representing the 23.6% retracement of the historical depreciation from 1419.96 to 80.60. Following the pair’s recent appreciation, important technical levels include the 416.00, 409.64, 389.91, 383.02, 374.83, and 360.04 areas. Traders are observing that the 50-bar MA (4-hourly) is bullishly indicating above the 100-bar MA (4-hourly) and above the 200-bar MA (4-hourly). Also, the 50-bar MA (hourly) is bullishly indicating above the 100-bar MA (hourly) and above the 200-bar MA (hourly).
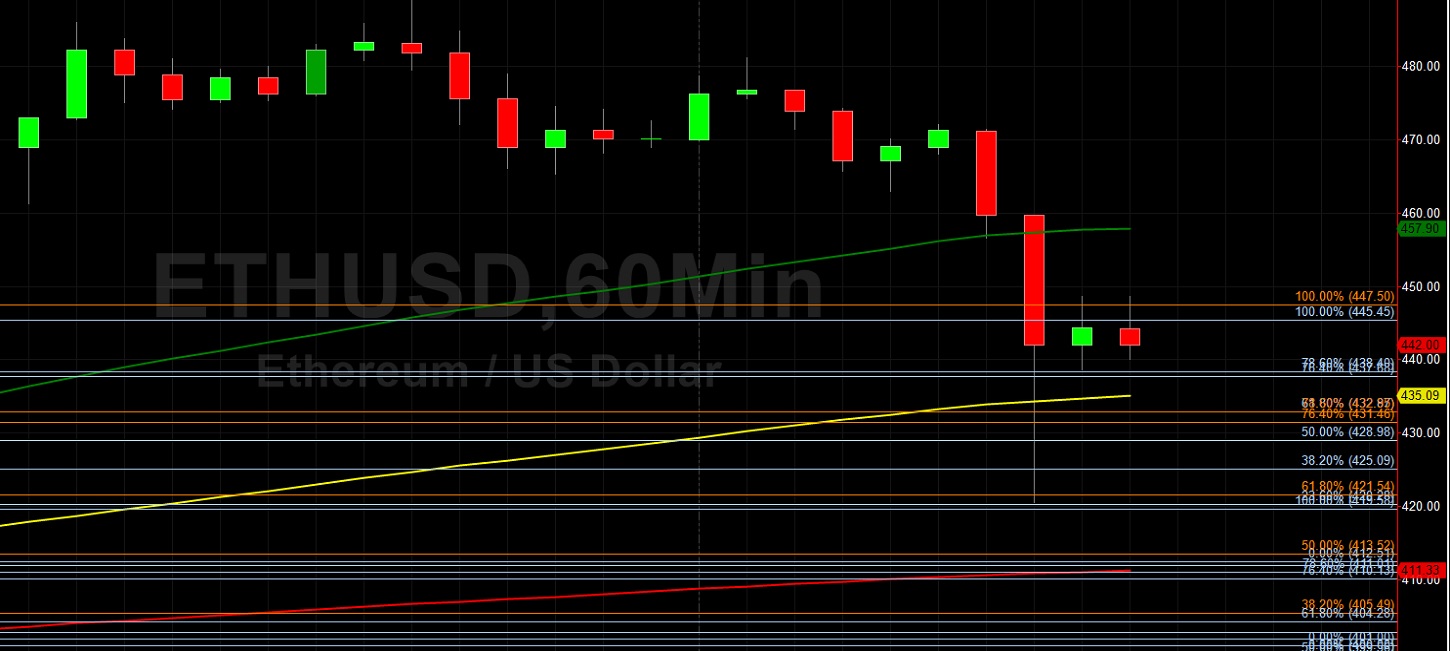
Price activity is nearest the 50-bar MA (4-hourly) at 412.28 and the 100-bar MA (Hourly) at 435.08.
Technical Support is expected around 349.75/ 331.95/ 315.08 with Stops expected below.
Technical Resistance is expected around 488.95/ 498.68/ 516.03 with Stops expected above.
On 4-Hourly chart, SlowK is Bearishly below SlowD while MACD is Bearishly below MACDAverage.
On 60-minute chart, SlowK is Bullishly above SlowD while MACD is Bearishly below MACDAverage.