By Dmitriy Gurkovskiy, Chief Analyst at RoboForex
The cryptocurrency market continues trading sideways. May assets are stuck between their respective support and resistance levels and the uncertainty will continue until one of them is broken. Moreover, on shorter timeframes of some assets, such as Ethereum, Litecoin, XRP, and Chainlink, prices are forming reversal patterns in favor of further growth. To complete them, there must be another descending movement, which may be followed by new rising waves. The key level for Bitcoin is $10,000: if bulls fail to protect this area, the next downside target may be at $8,000. This, in its turn, may stop the entire cryptocurrency market from further ascending movement.
Bitcoin
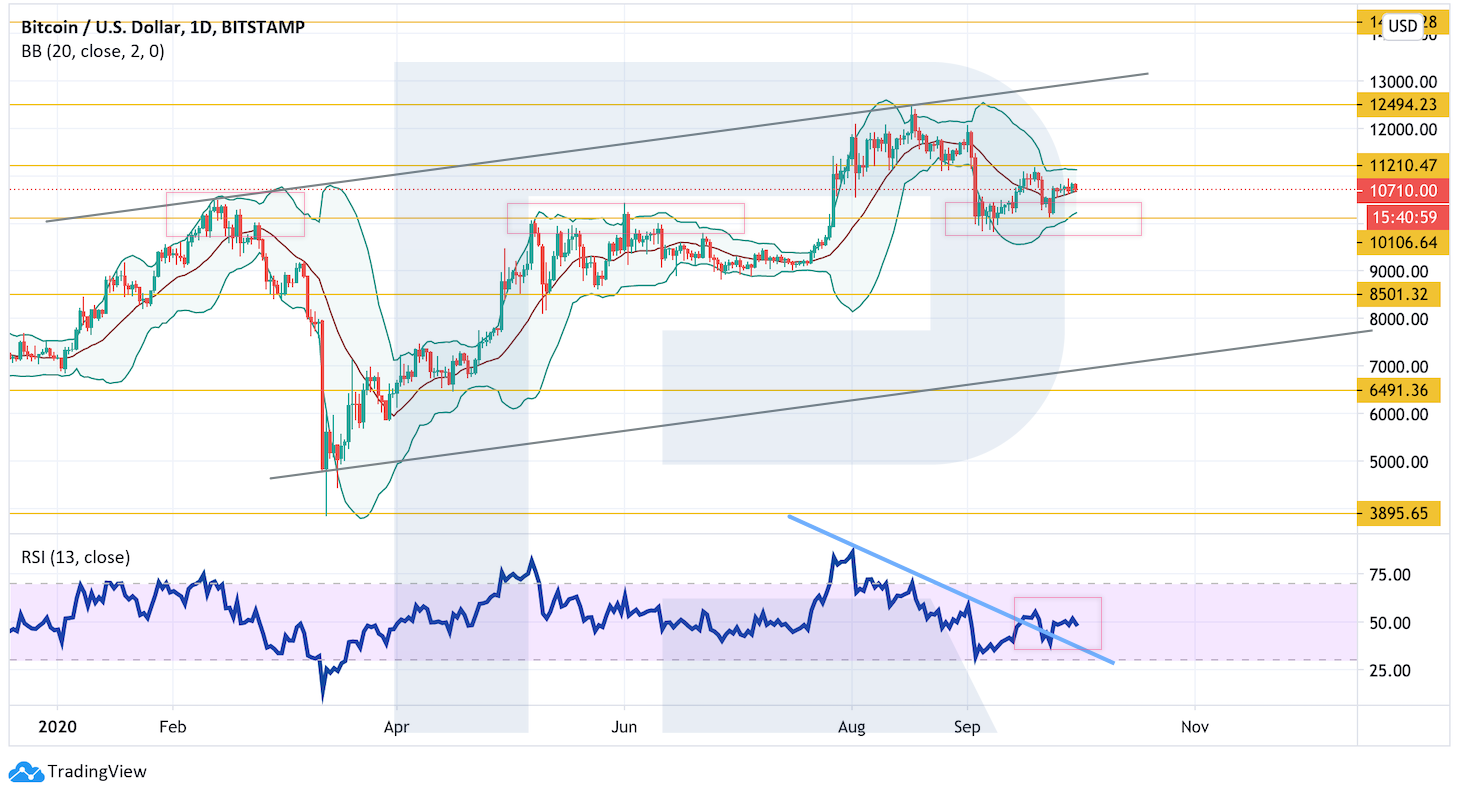
In the daily chart, Bitcoin is still moving above the support area but hasn’t broken $11,200 so far. As we can see, the situation remains quite uncertain and the asset is stuck between two important levels. Neither bulls nor bears are strong enough to break this channel. A signal in favor of further growth is a breakout of the descending trendline at the RSI. As a rule, such signals indicate breakouts of a similar line or the closest resistance level on the price chart. A breakout of $11,200 will lead to further growth towards $12,495 or even higher. However, if bears are able to break $10,000, the pair may continue falling to reach $8,000 while forming a bullish “5-0” pattern. Such a pattern implies a rebound from the rising channel’s downside border and further growth of BTC/USD in the future.
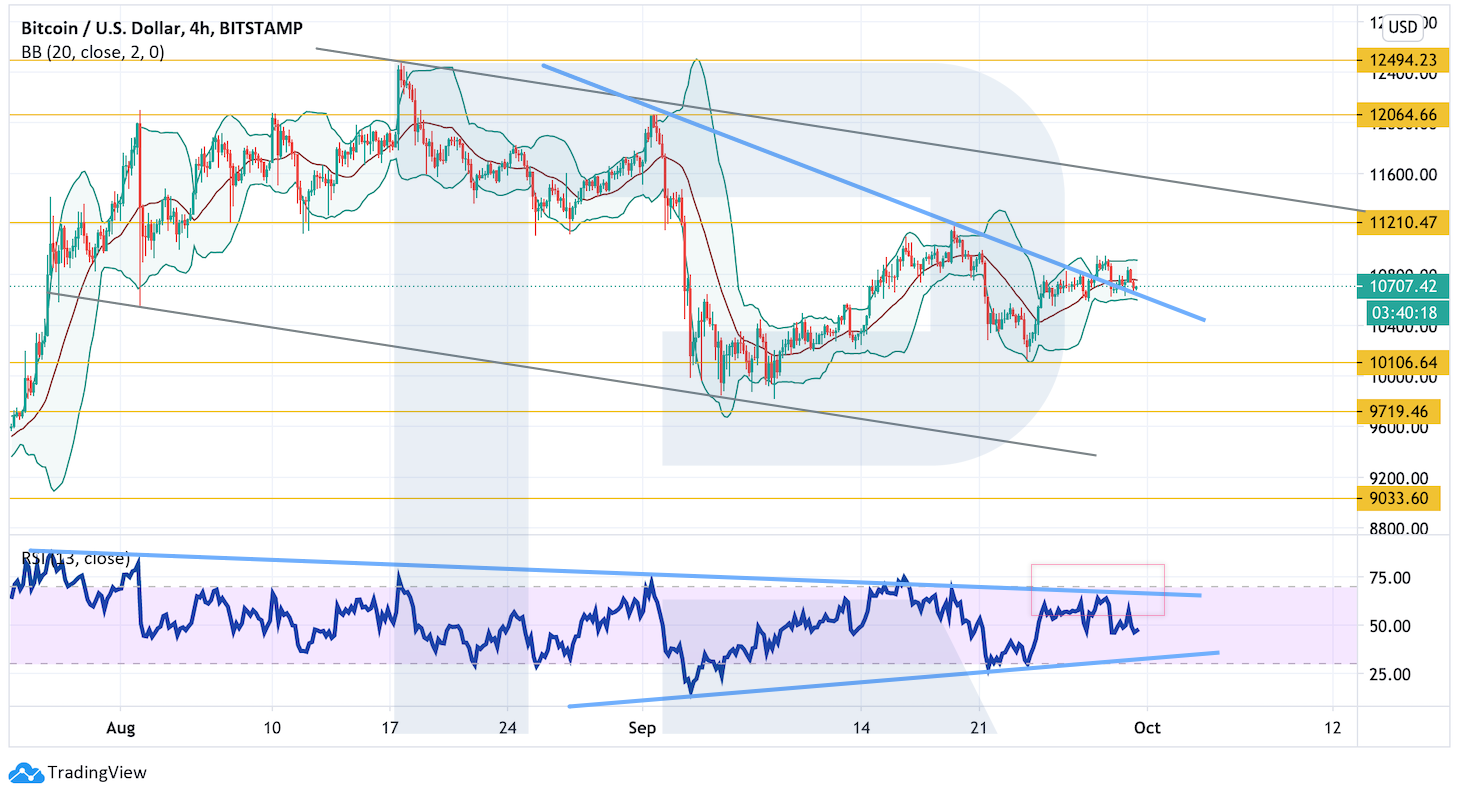
As we can see in the h4 chart, the cryptocurrency has broken the neckline of an Inverted Head & Shoulders reversal pattern. However, to confirm further growth, the asset must break the closest high and fox above $11,200. In this case, one may consider the start of the pattern materialization with the target above $13,500. Still, this scenario may no longer be valid if the instrument plummets and fixes below $10,105. After that, the above-mentioned reversal pattern may be canceled and the market will continue trading downwards to reach $9,035.
Ethereum
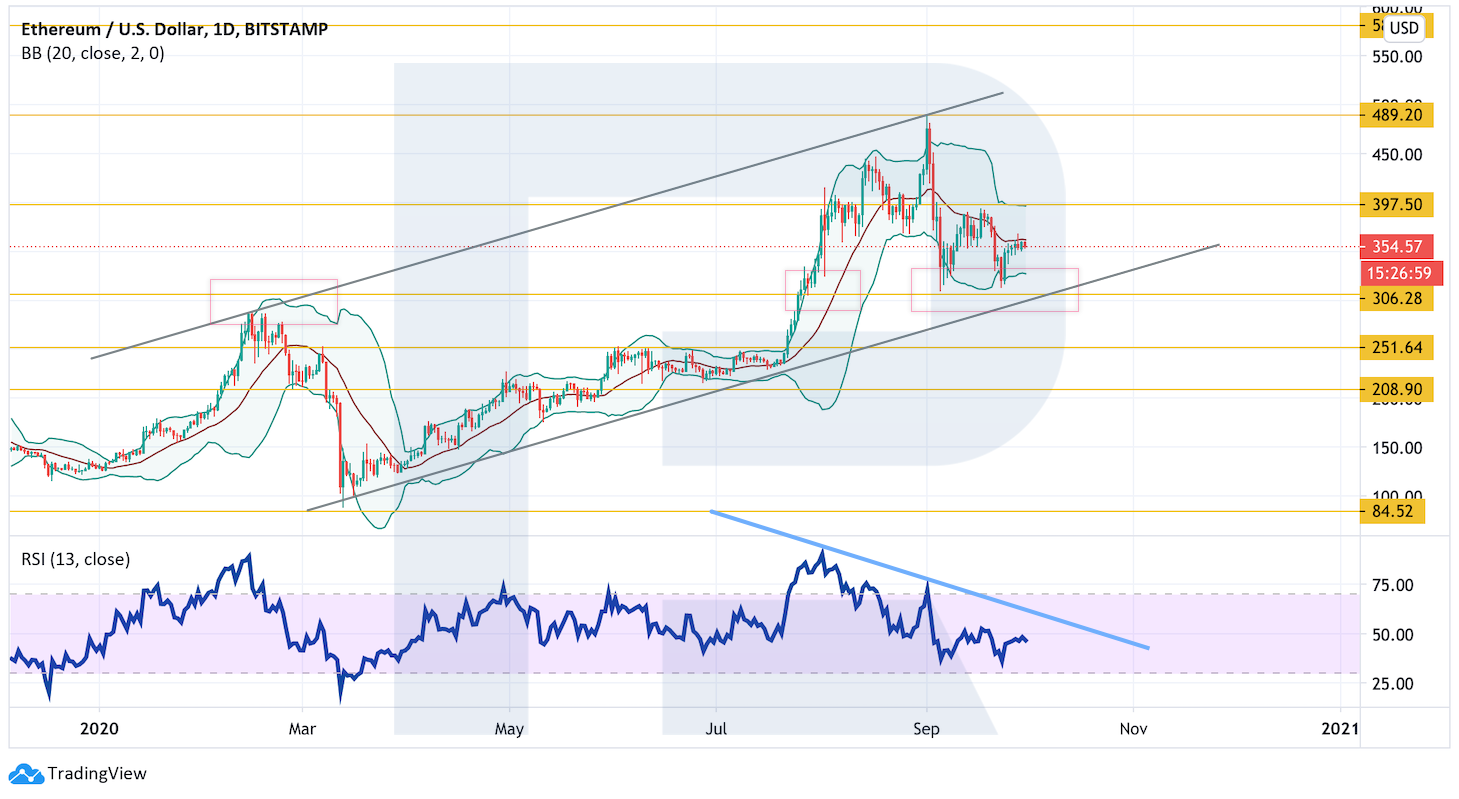
As we can see in the daily chart, ETH/USD is still rebounding from the middle band of the Bollinger Bands indicator, thus implying a bearish pressure. In general, there is a potential for the completion of a bullish “5-0” pattern: unlike Bitcoin, Ethereum got very close to the rising channel’s downside border. However, the RSI indicator hasn’t broken the trendline – such a breakout might have been an additional signal in favor of further growth. To continue pushing the asset upwards, bulls must break the closest resistance level and fix above $397. Still, this scenario may no longer be valid if the pair breaks the rising channel’s downside border and fix below $250. In this case, the above-mentioned pattern may be canceled and the instrument will continue falling with the target at $150.
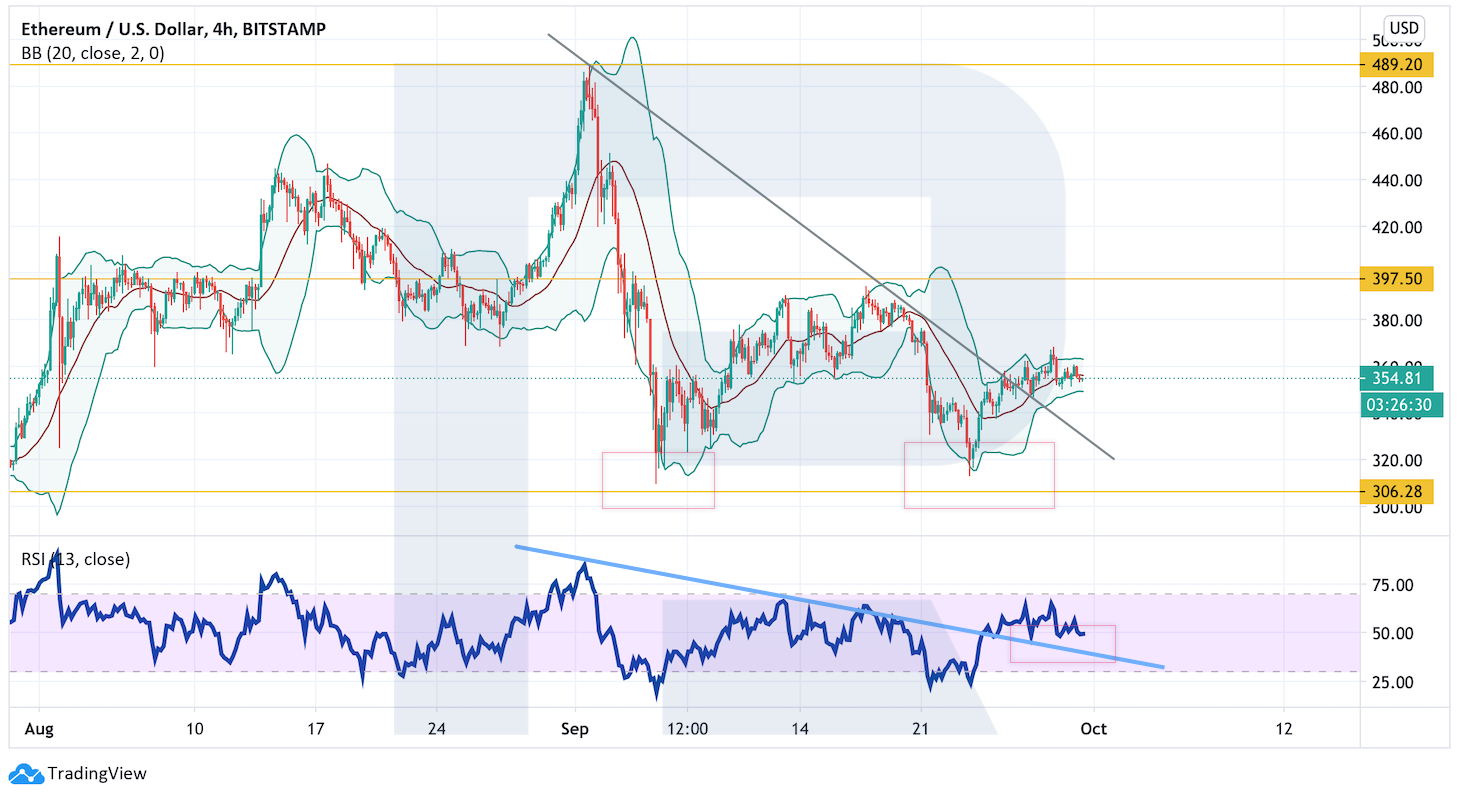
On shorter timeframes, the pair has broken the descending trendline and the current price movement is still looking like a Double Bottom reversal pattern. A breakout of the trendline is the first signal in favor of a new growth within the frameworks of the pattern materialization. An additional signal in favor of this idea will be a breakout of the trendline at the RSI. To confirm this scenario, the cryptocurrency must break the resistance area and fix above $397. However, if bears make the asset plunge and fix below $306, the abovementioned pattern may be canceled and the instrument will continue trading downwards to reach $250.
Litecoin
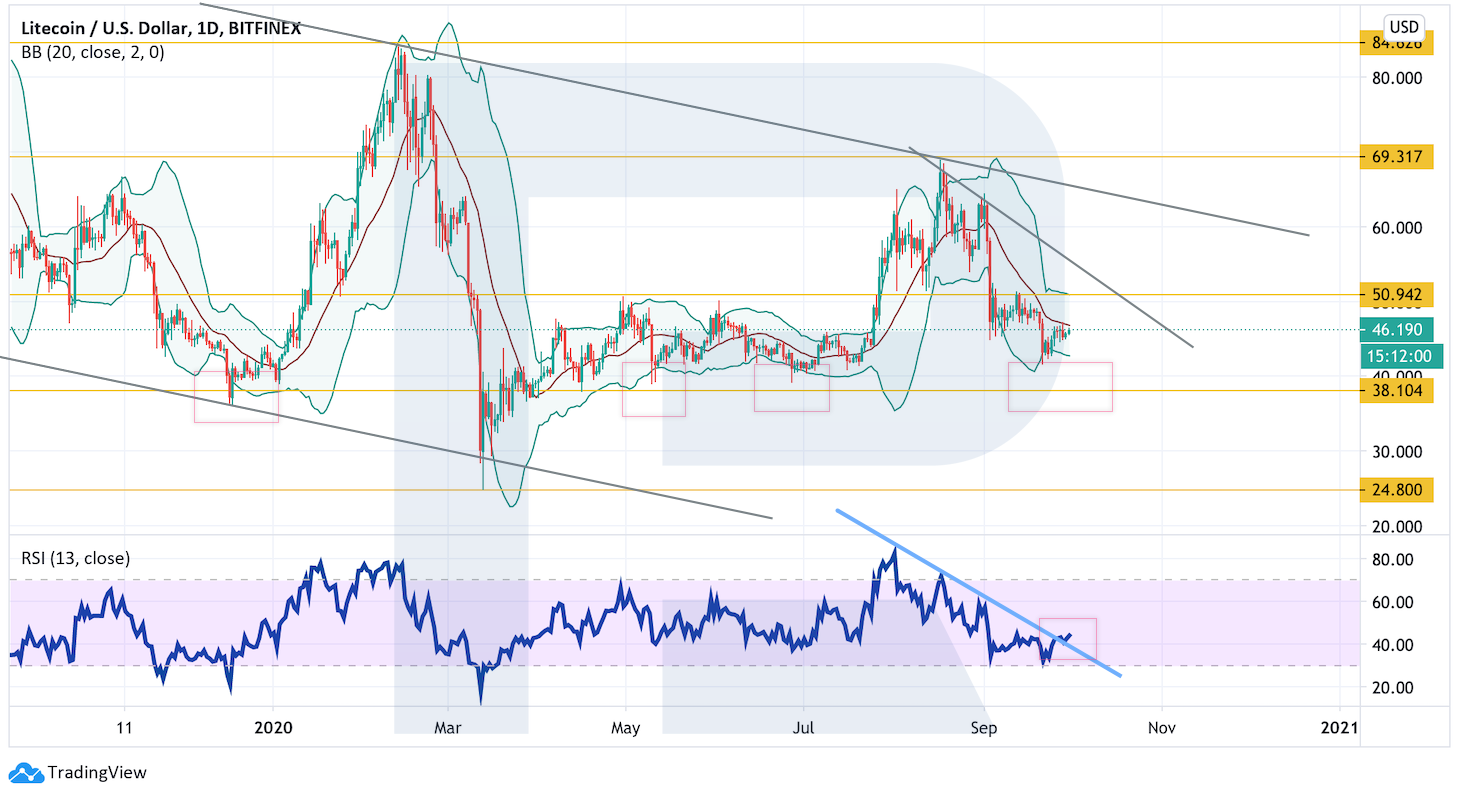
In the daily chart, Litecoin is rebounding from the support area. Just like Bitcoin, this asset has also broken the descending trendline of the RSI, so a similar line can be broken on the price chart as well. the next upside target may be at $52. However, there are of the formation of a Head & Shoulders reversal pattern, that’s why it’s very important for bulls to keep the price from breaking the support area and fixing below $38. If they fail, the asset may continue falling to reach $25. Still, a strong signal in favor of a proper rising movement will be a breakout of the descending channel’s upside border and a fixation above $70.
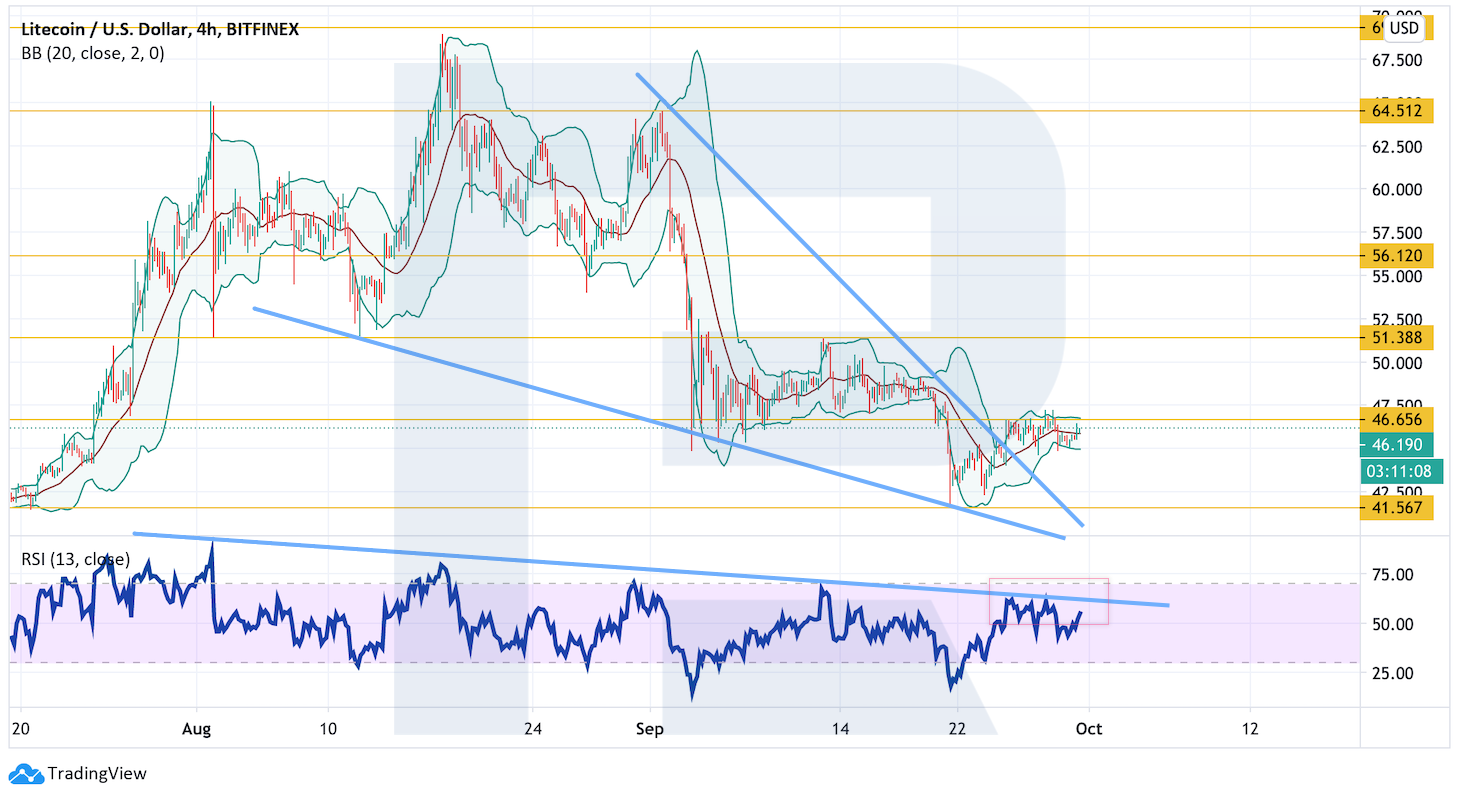
As we can see in the H4 chart, the cryptocurrency has broken the upside border of a Wedge pattern, that’s why there are good chances to see further growth of the asset in the nearest future. A strong signal in favor of this idea will be a breakout of the descending trendline at the RSI. However, this bullish scenario may no longer be valid if the price breaks the local low and fixes below $41.55. After that, the instrument may continue trading downwards to reach $35 or even lower.
XRP
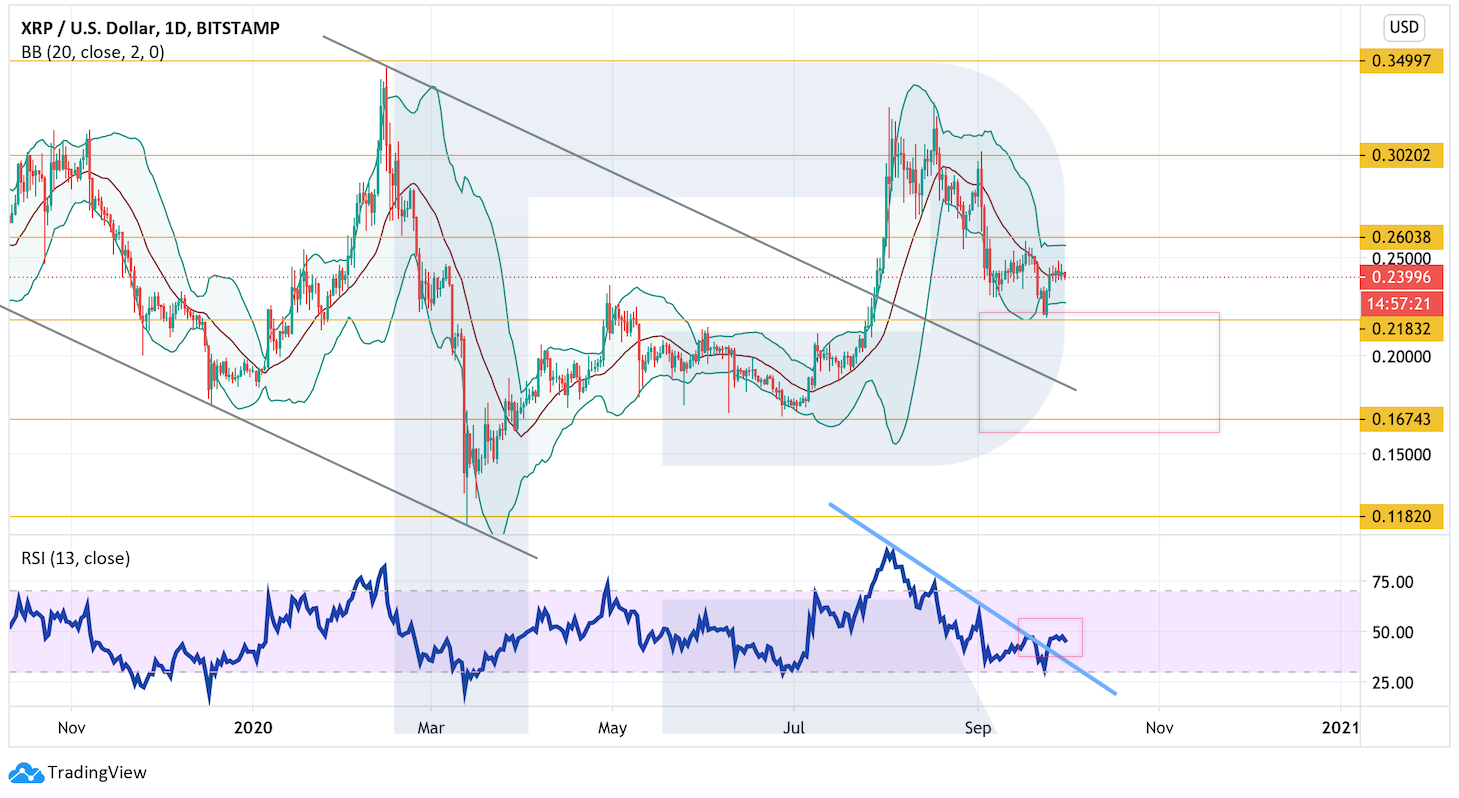
As we can see in the daily chart, XRP has rebounded from the support area but isn’t moving low enough to complete a large Inverted Head & Shoulders reversal pattern. The RSI indicator has also broken the descending trendline to hint at further growth towards $0.3020. To confirm this idea, the asset must break the upside border of the Bollinger Bands indicator and fix above $ 0.2605. However, this scenario may no longer be valid if the market breaks the support area and fixes below $0.2180. After that, the instrument may continue falling with the target at $0.1675.
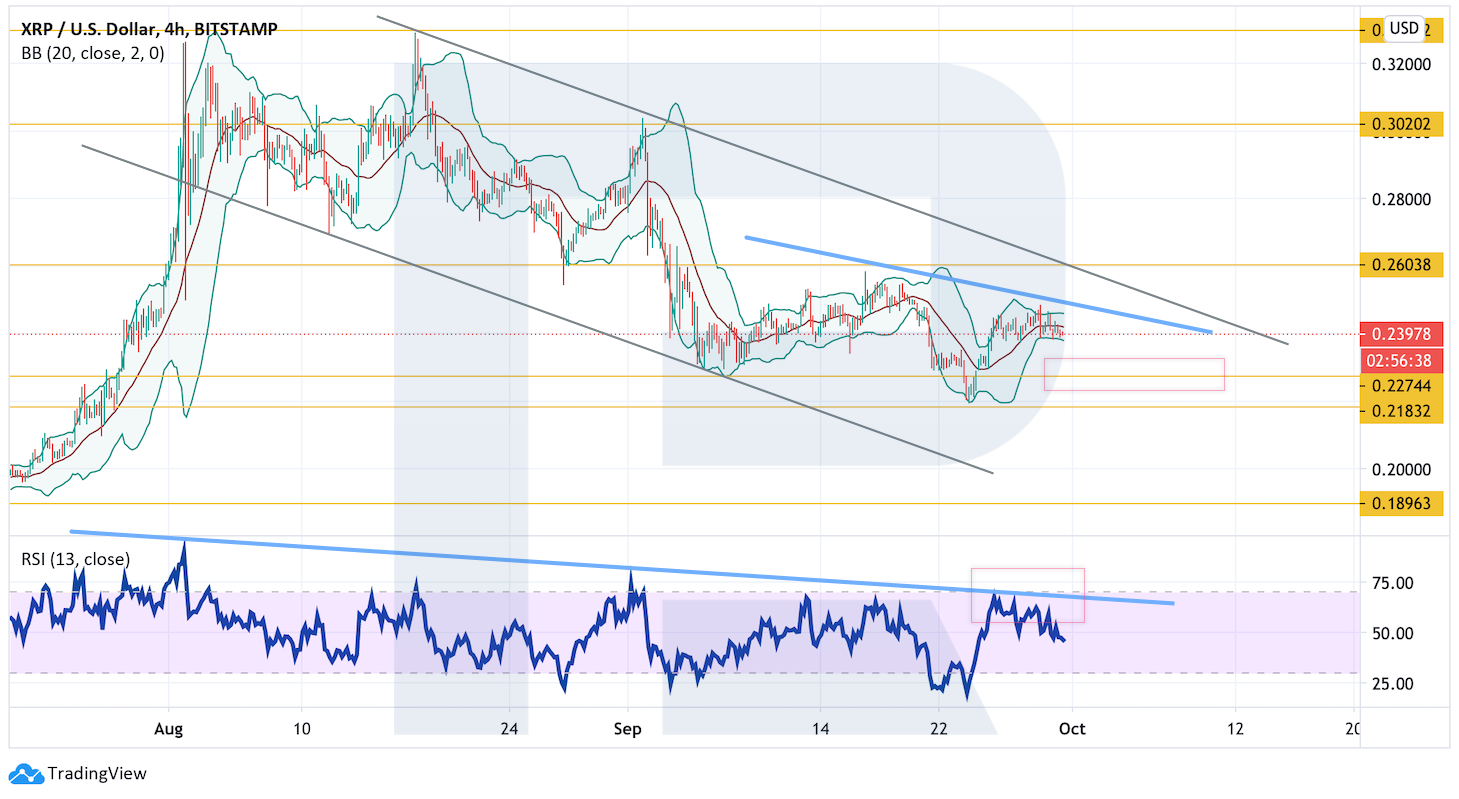
On shorter timeframes, there is also a potential for the formation of an Inverted Head & Shoulders reversal pattern – to complete the pattern, the asset must test $0.2275, where it may finish the Right Shoulder and start a new growth within the frameworks of the pattern materialization. To confirm this idea, the price must break the resistance area and fix above $0.2605, thus indicating a breakout of the descending channel. However, this scenario may be canceled if the market breaks the local low and fixes below $0.2180. After that, the instrument may continue its decline to reach $0.1895.
Chainlink
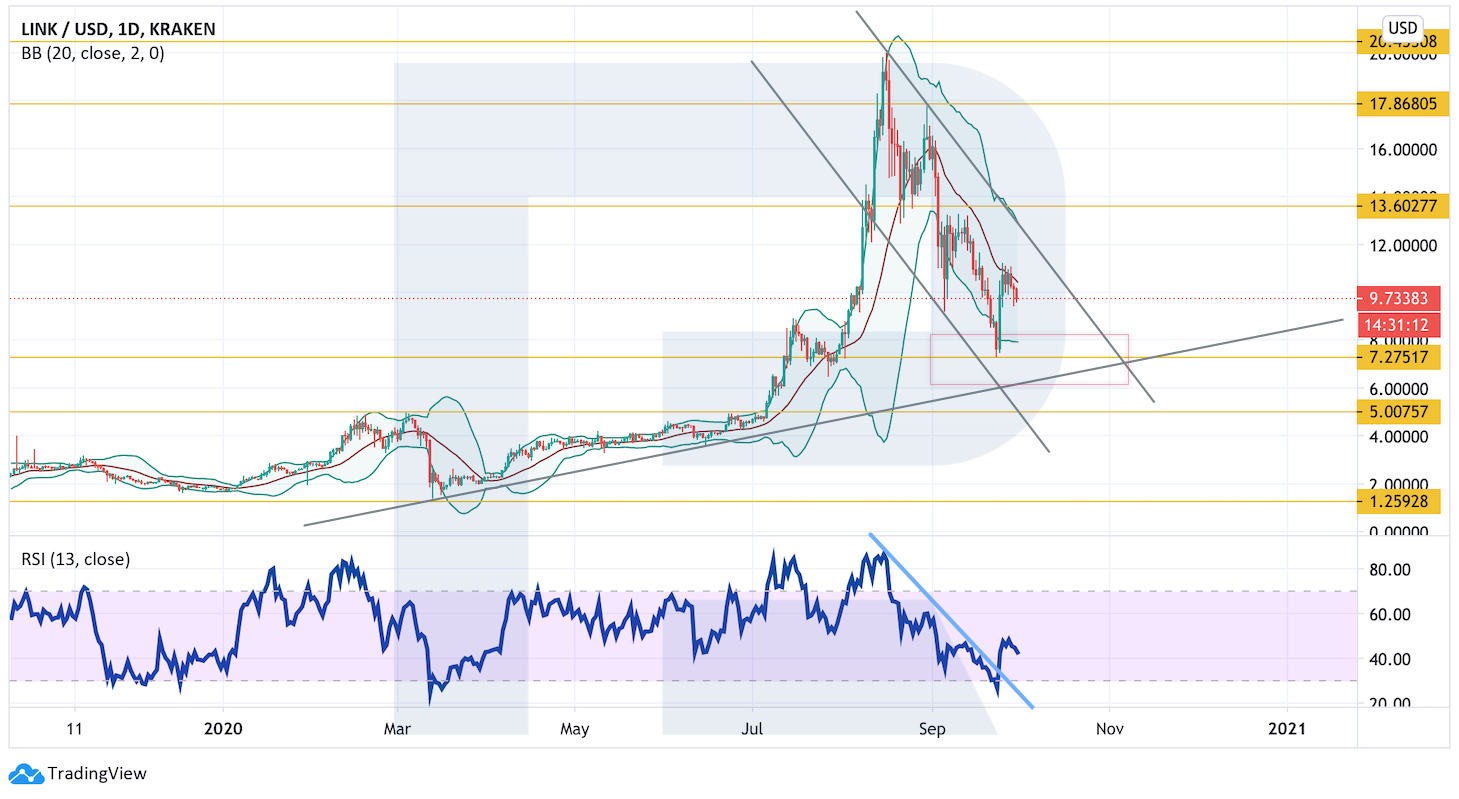
In the daily chart, Chainlink is correcting downwards. However, the RSI indicator has already broken the descending trendline, so there are good chances to see the completion of this decline and the start of another rising movement. To confirm this idea, the cryptocurrency must break the descending channel’s upside border and fix above $13.60. In this case, the asset may continue growing with the target at $17.85. However, this scenario may be canceled if the price breaks the rising channel’s downside border and fixes below $5.00. After that, the instrument may move downwards to reach $1.25.
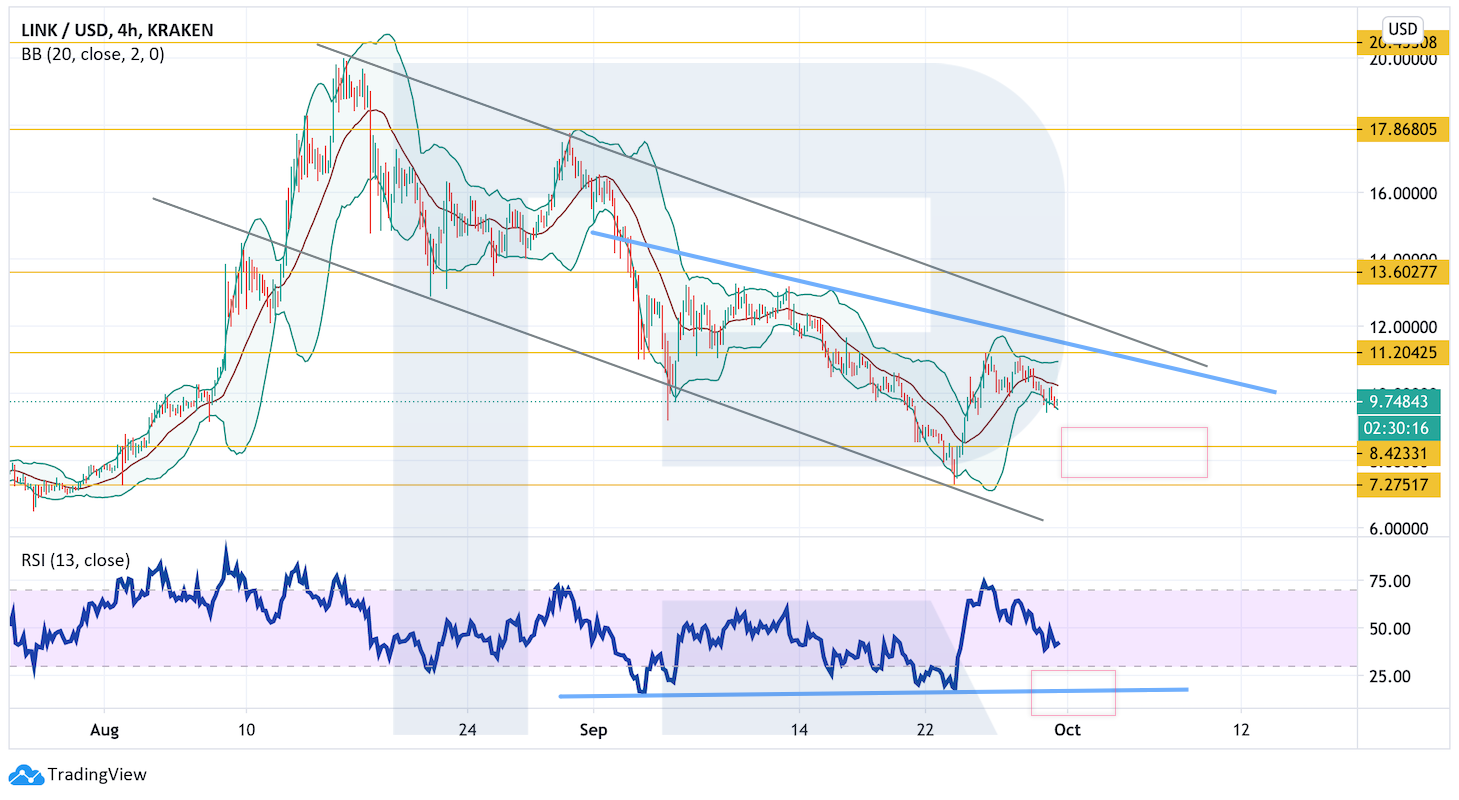
On shorter timeframes, the asset is falling within the channel and there is a potential for the formation of a Head & Shoulders reversal pattern provided that the price tests $8.42 and rebounds from it in order to resume growing. To confirm this idea, the cryptocurrency must break the resistance area and fix above $11.20, thus implying a breakout of the descending channel’s upside border and further growth towards $13.60 and higher. However, this scenario may no longer be valid if the market breaks the local low and fixes below $7.25. In this case, the above-mentioned reversal pattern may be canceled and the instrument will continue trading downwards.
Disclaimer
Any predictions contained herein are based on the author's particular opinion. This analysis shall not be treated as trading advice. RoboForex shall not be held liable for the results of the trades arising from relying upon trading recommendations and reviews contained herein.
© 2020 CryptoDaily All Rights Reserved. This article is provided for informational purposes only. It is not offered or intended to be used as legal, tax, investment, financial, or other advice.


By Dmitriy Gurkovskiy, Chief Analyst at RoboForex
The cryptocurrency market continues trading sideways. May assets are stuck between their respective support and resistance levels and the uncertainty will continue until one of them is broken. Moreover, on shorter timeframes of some assets, such as Ethereum, Litecoin, XRP, and Chainlink, prices are forming reversal patterns in favor of further growth. To complete them, there must be another descending movement, which may be followed by new rising waves. The key level for Bitcoin is $10,000: if bulls fail to protect this area, the next downside target may be at $8,000. This, in its turn, may stop the entire cryptocurrency market from further ascending movement.
Bitcoin
In the daily chart, Bitcoin is still moving above the support area but hasn’t broken $11,200 so far. As we can see, the situation remains quite uncertain and the asset is stuck between two important levels. Neither bulls nor bears are strong enough to break this channel. A signal in favor of further growth is a breakout of the descending trendline at the RSI. As a rule, such signals indicate breakouts of a similar line or the closest resistance level on the price chart. A breakout of $11,200 will lead to further growth towards $12,495 or even higher. However, if bears are able to break $10,000, the pair may continue falling to reach $8,000 while forming a bullish “5-0” pattern. Such a pattern implies a rebound from the rising channel’s downside border and further growth of BTC/USD in the future.
As we can see in the h4 chart, the cryptocurrency has broken the neckline of an Inverted Head & Shoulders reversal pattern. However, to confirm further growth, the asset must break the closest high and fox above $11,200. In this case, one may consider the start of the pattern materialization with the target above $13,500. Still, this scenario may no longer be valid if the instrument plummets and fixes below $10,105. After that, the above-mentioned reversal pattern may be canceled and the market will continue trading downwards to reach $9,035.
Ethereum
As we can see in the daily chart, ETH/USD is still rebounding from the middle band of the Bollinger Bands indicator, thus implying a bearish pressure. In general, there is a potential for the completion of a bullish “5-0” pattern: unlike Bitcoin, Ethereum got very close to the rising channel’s downside border. However, the RSI indicator hasn’t broken the trendline – such a breakout might have been an additional signal in favor of further growth. To continue pushing the asset upwards, bulls must break the closest resistance level and fix above $397. Still, this scenario may no longer be valid if the pair breaks the rising channel’s downside border and fix below $250. In this case, the above-mentioned pattern may be canceled and the instrument will continue falling with the target at $150.
On shorter timeframes, the pair has broken the descending trendline and the current price movement is still looking like a Double Bottom reversal pattern. A breakout of the trendline is the first signal in favor of a new growth within the frameworks of the pattern materialization. An additional signal in favor of this idea will be a breakout of the trendline at the RSI. To confirm this scenario, the cryptocurrency must break the resistance area and fix above $397. However, if bears make the asset plunge and fix below $306, the abovementioned pattern may be canceled and the instrument will continue trading downwards to reach $250.
Litecoin
In the daily chart, Litecoin is rebounding from the support area. Just like Bitcoin, this asset has also broken the descending trendline of the RSI, so a similar line can be broken on the price chart as well. the next upside target may be at $52. However, there are of the formation of a Head & Shoulders reversal pattern, that’s why it’s very important for bulls to keep the price from breaking the support area and fixing below $38. If they fail, the asset may continue falling to reach $25. Still, a strong signal in favor of a proper rising movement will be a breakout of the descending channel’s upside border and a fixation above $70.
As we can see in the H4 chart, the cryptocurrency has broken the upside border of a Wedge pattern, that’s why there are good chances to see further growth of the asset in the nearest future. A strong signal in favor of this idea will be a breakout of the descending trendline at the RSI. However, this bullish scenario may no longer be valid if the price breaks the local low and fixes below $41.55. After that, the instrument may continue trading downwards to reach $35 or even lower.
XRP
As we can see in the daily chart, XRP has rebounded from the support area but isn’t moving low enough to complete a large Inverted Head & Shoulders reversal pattern. The RSI indicator has also broken the descending trendline to hint at further growth towards $0.3020. To confirm this idea, the asset must break the upside border of the Bollinger Bands indicator and fix above $ 0.2605. However, this scenario may no longer be valid if the market breaks the support area and fixes below $0.2180. After that, the instrument may continue falling with the target at $0.1675.
On shorter timeframes, there is also a potential for the formation of an Inverted Head & Shoulders reversal pattern – to complete the pattern, the asset must test $0.2275, where it may finish the Right Shoulder and start a new growth within the frameworks of the pattern materialization. To confirm this idea, the price must break the resistance area and fix above $0.2605, thus indicating a breakout of the descending channel. However, this scenario may be canceled if the market breaks the local low and fixes below $0.2180. After that, the instrument may continue its decline to reach $0.1895.
Chainlink
In the daily chart, Chainlink is correcting downwards. However, the RSI indicator has already broken the descending trendline, so there are good chances to see the completion of this decline and the start of another rising movement. To confirm this idea, the cryptocurrency must break the descending channel’s upside border and fix above $13.60. In this case, the asset may continue growing with the target at $17.85. However, this scenario may be canceled if the price breaks the rising channel’s downside border and fixes below $5.00. After that, the instrument may move downwards to reach $1.25.
On shorter timeframes, the asset is falling within the channel and there is a potential for the formation of a Head & Shoulders reversal pattern provided that the price tests $8.42 and rebounds from it in order to resume growing. To confirm this idea, the cryptocurrency must break the resistance area and fix above $11.20, thus implying a breakout of the descending channel’s upside border and further growth towards $13.60 and higher. However, this scenario may no longer be valid if the market breaks the local low and fixes below $7.25. In this case, the above-mentioned reversal pattern may be canceled and the instrument will continue trading downwards.
Disclaimer
Any predictions contained herein are based on the author's particular opinion. This analysis shall not be treated as trading advice. RoboForex shall not be held liable for the results of the trades arising from relying upon trading recommendations and reviews contained herein.
© 2020 CryptoDaily All Rights Reserved. This article is provided for informational purposes only. It is not offered or intended to be used as legal, tax, investment, financial, or other advice.