Published
3 years ago on
October 01, 2020
Bitcoin (BTC/USD) continued to orbit the 10700 level early in today’s Asian session as the pair remained below the 10860.79 intraday high from yesterday’s Asian session, and above the 10657.04 intraday low from yesterday’s European session. Traders are seeking to discern fresh market sentiment to determine BTC/USD’s next likely movements. Chartists are observing that the 100-hour simple moving average has just bearishly moved above the 50-hour simple moving average, while the 100-bar 4-hourly simple moving average is bullishly converging with the 200-bar 4-hourly simple moving average. Selling pressure recently continued until buying pressure emerged around the 10621.22 area, just above the 61.8% retracement of the historical depreciating range from 13202.63 to 6430.00. Traders also recently observed an acceleration of selling pressure below additional retracement levels including the 10685.51 and 10449.19 areas, with the latter being the 23.6% retracement of the depreciating range from 12486.61 to 9819.83.
Stops were recently elected below the 11120, 11004.10, 10961.41, 10647.72, 10546.15, and 10450.26 areas during the recent depreciation from recent multi-week highs. Traders note that the recent high of 12486.61 represented a test of the 12496.68 area, an upside price objective related to buying pressure that emerged around the 8055.91 area earlier this year. Traders also remain focused on the 12023.45, 11964.56, 11880.38, 11803.31, 11737.30, 11642.95, 11560.28, and 11533.51 areas during pullbacks higher, representing the retracements of the recent appreciating ranges that commenced around the 9005.00, 8905.84, 8815.01, and 8632.93 areas. Other important technical levels include the 11510.44 area, representing the 50% retracement of a historical depreciation from 19891.99 to 3128.89, as well as the 10200.39, 10139.11, and 10082.97 areas. Chartists are observing that the 50-bar MA (4-hourly) is bearishly indicating below the 200-bar MA (4-hourly) and below the 100-bar MA (4-hourly). Also, the 50-bar MA (hourly) is bearishly indicating below the 100-bar MA (hourly) and above the 200-bar MA (hourly).
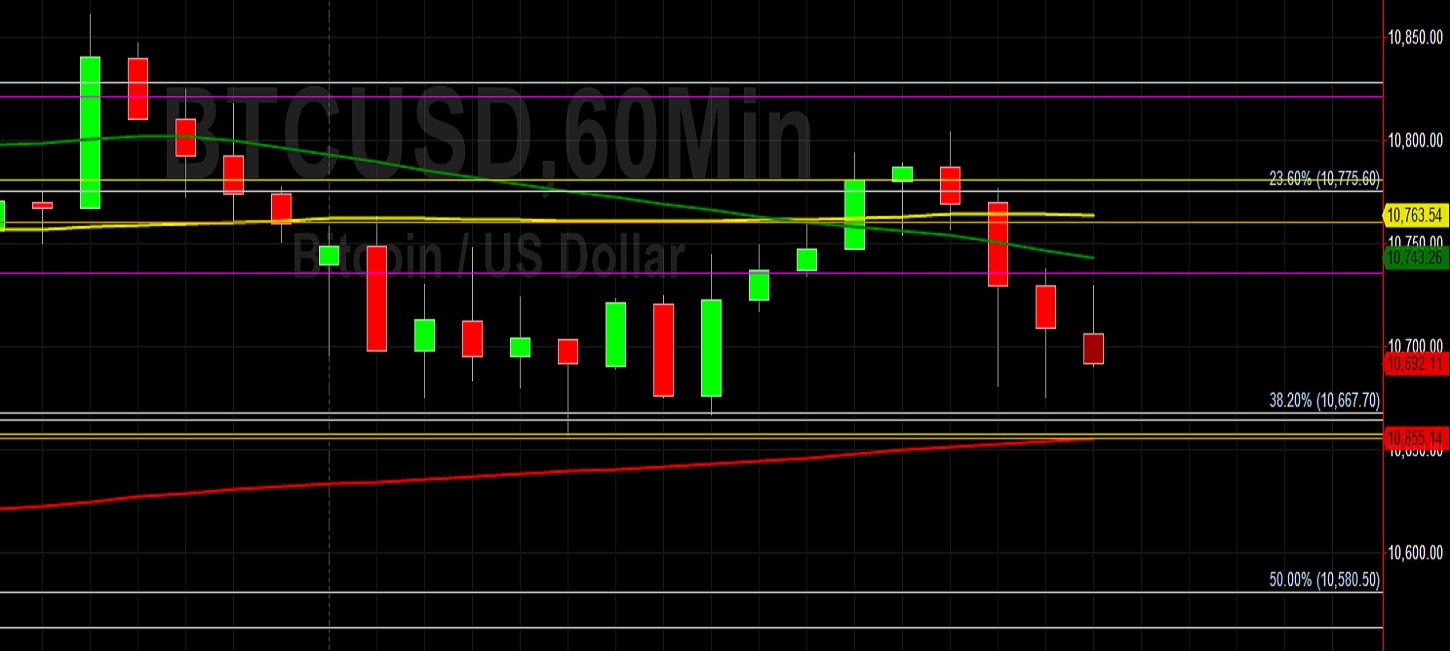
Price activity is nearest the 50-bar MA (4-hourly) at 10659.35 and the 200-bar MA (Hourly) at 10655.14.
Technical Support is expected around 10135.22/ 9816.32/ 9861.42 with Stops expected below.
Technical Resistance is expected around 11179.90/ 11496.70/ 11601.04 with Stops expected above.
On 4-Hourly chart, SlowK is Bullishly above SlowD while MACD is Bearishly below MACDAverage.
On 60-minute chart, SlowK is Bearishly below SlowD while MACD is Bearishly below MACDAverage.
Investment Disclaimer