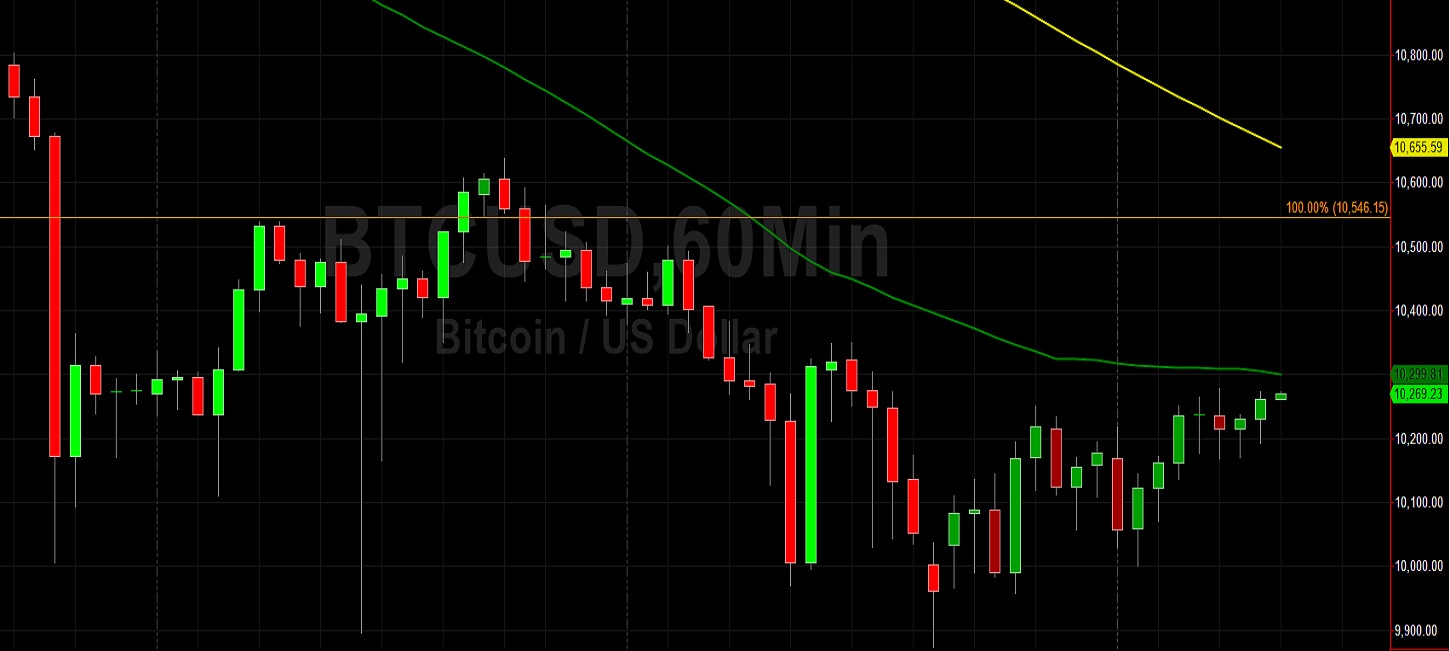
Bitcoin (BTC/USD) attempted to win back some recent lost ground in today’s Asian session as the pair continued to look for upward buying pressure after having recently traded below the psychologically-important 10000 figure, and as low as the 9895.22 area. Buying pressure emerged right at the 10000 figure during yesterday’s European session, followed by additional upward pressure around the 10168.31 area. Traders are focused on a couple of the pair’s initial upside challenges. The 10395.81 area represents the 23.6% retracement of the recent depreciating range from 12086 to 9873.71, and the 10490.35 area represents the 23.6% retracement of the depreciating range from 12486.61 to 9873.71. Additional upside retracement areas include 10718.90, 10871.84, 10979.86, and 11180.16. Technical resistance emerged after traders were unable to push the pair back above the 10826.66 area in a pullback higher last week, a level that represents the 61.8% retracement of the recent appreciation from 8940.14 to 13878.67. BTC/USD later encountered additional technical resistance just below the 10540.49 area in a pullback lower, driving the pair to its weakest print since late July. Stops were recently elected below the 11120, 11004.10, 10961.41, 10647.72, 10546.15, and 10450.26 areas during the depreciation from recent multi-week highs. BTC/USD is now at risk of depreciating further and testing levels including 9816.32, 9772.95, 9681.42, 9532.39, and 9301.26 levels.
Traders note that the recent high of 12486.61 represented a test of the 12496.68 area, an upside price objective related to buying pressure that emerged around the 8055.91 area earlier this year. Traders also remain focused on the 12023.45, 11964.56, 11880.38, 11803.31, 11737.30, 11642.95, 11560.28, and 11533.51 areas during pullbacks higher, representing the retracements of the recent appreciating ranges that commenced around the 9005.00, 8905.84, 8815.01, and 8632.93 areas. Other important technical levels include the 11510.44 area, representing the 50% retracement of a historical depreciation from 19891.99 to 3128.89, as well as the 10200.39, 10139.11, and 10082.97 areas Chartists are observing that the 50-bar MA (4-hourly) is bearishly indicating below the 100-bar MA (4-hourly) and below the 200-bar MA (4-hourly). Also, the 50-bar MA (hourly) is bearishly indicating below the 100-bar MA (hourly) and below the 200-bar MA (hourly).
Price activity is nearest the 50-bar MA (4-hourly) at 11163.40 and the 50-bar MA (Hourly) at 10304.70.
Technical Support is expected around 9895.22/ 9816.32/ 9681.42 with Stops expected below.
Technical Resistance is expected around 10885.13/ 11190.92/ 11496.70 with Stops expected above.
On 4-Hourly chart, SlowK is Bullishly above SlowD while MACD is Bullishly above MACDAverage.
On 60-minute chart, SlowK is Bearishly below SlowD while MACD is Bullishly above MACDAverage.