Bitcoin (BTC/USD) looked for fresh trading sentiment early in today’s Asian session as the pair continued to trade above the psychologically-important 10000 figure. Market activity was confined to a tight range during yesterday’s Asian, European, and North American sessions, the latest evidence that traders await fresh trading ideas. Bids emerged around the 10200 level during yesterday’s European session, and traders were unable to move the pair above the 10384.23 level during yesterday’s Asian session. BTC/USD continues to orbit the 50-bar, 4-hourly simple moving average, and has recently moved above the 50-hour and 200-hour simple moving averages. BTC/USD bulls are looking to see if the pair can establish a base above the 10354.65 area, representing the 23.6% retracement of the depreciating range from 12086 to 9819.83. The next upside retracement levels in this depreciating range include the 10685.51, 10952.92, 11220.32, and 11551.18 areas. Also, the 10449.19 area represents the 23.6% retracement of the depreciating range from 12486.61 to 9819.83. Technical resistance emerged after traders were unable to push the pair back above the 10826.66 area in a pullback higher last week, a level that represents the 61.8% retracement of the recent appreciation from 8940.14 to 13878.67.
Stops were recently elected below the 11120, 11004.10, 10961.41, 10647.72, 10546.15, and 10450.26 areas during the depreciation from recent multi-week highs. Traders note that the recent high of 12486.61 represented a test of the 12496.68 area, an upside price objective related to buying pressure that emerged around the 8055.91 area earlier this year. Traders also remain focused on the 12023.45, 11964.56, 11880.38, 11803.31, 11737.30, 11642.95, 11560.28, and 11533.51 areas during pullbacks higher, representing the retracements of the recent appreciating ranges that commenced around the 9005.00, 8905.84, 8815.01, and 8632.93 areas. Other important technical levels include the 11510.44 area, representing the 50% retracement of a historical depreciation from 19891.99 to 3128.89, as well as the 10200.39, 10139.11, and 10082.97 areas Chartists are observing that the 50-bar MA (4-hourly) is bearishly indicating below the 100-bar MA (4-hourly) and below the 200-bar MA (4-hourly). Also, the 50-bar MA (hourly) is bullishly indicating above the 100-bar MA (hourly) and above the 200-bar MA (hourly).
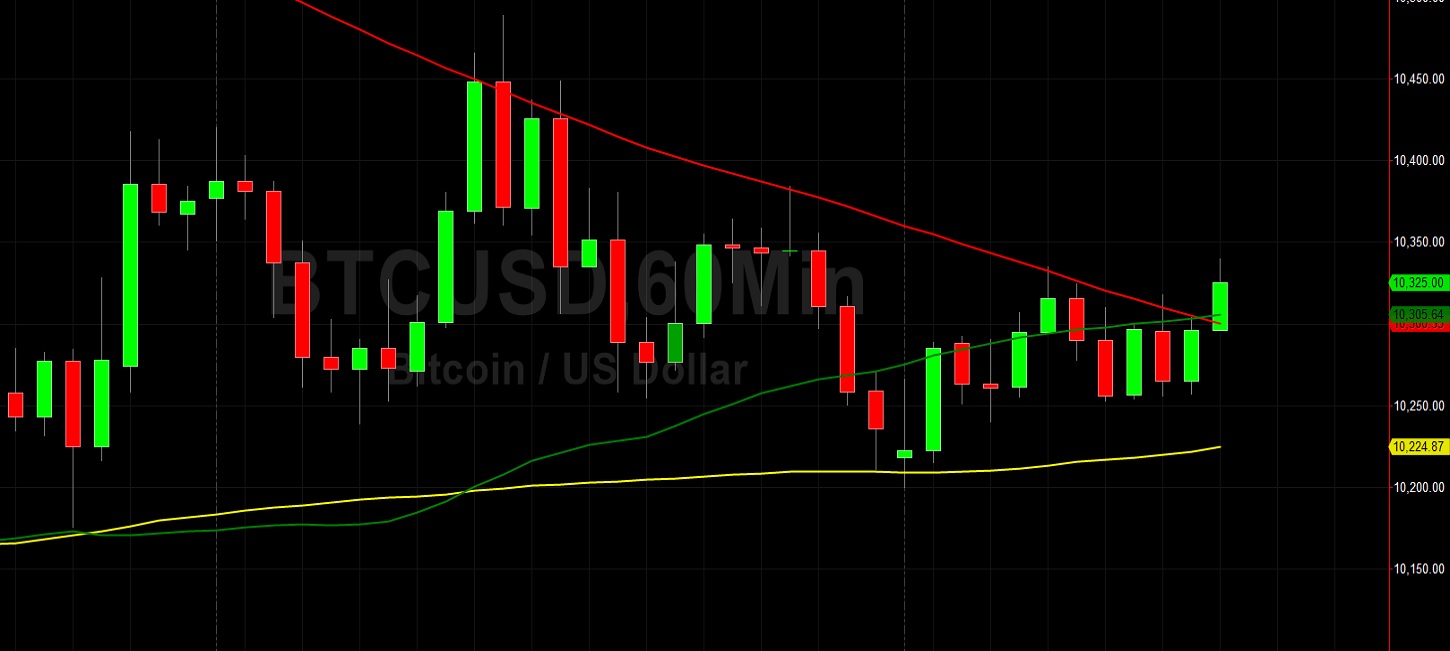
Price activity is nearest the 50-bar MA (4-hourly) at 10283.94 and the 50-bar MA (Hourly) at 10305.73.
Technical Support is expected around 9816.32/ 9681.42/ 9465.77 with Stops expected below.
Technical Resistance is expected around 10885.13/ 11190.92/ 11496.70 with Stops expected above.
On 4-Hourly chart, SlowK is Bearishly below SlowD while MACD is Bullishly above MACDAverage.
On 60-minute chart, SlowK is Bullishly above SlowD while MACD is Bullishly above MACDAverage.