Bitcoin (BTC/USD) extended its sharp pullback early in today’s Asian session as the pair continued to trade below the 11000 figure following significant selling pressure that commenced this week after trading as high as the 12086 area. Traders were unable to push the pair back above the 10826.66 area in a pullback higher during yesterday’s Asian session, a level that represents the 61.8% retracement of the recent appreciation from 8940.14 to 13878.67. BTC/USD later encountered additional technical resistance just below the 10540.49 area in a pullback lower during the European session, driving the pair to its weakest print since late July. Stops were recently elected below the 11120, 11004.10, 10961.41, 10647.72, 10546.15, and 10450.26 areas from recent multi-week highs. Traders note that the recent high of 12486.61 represented a test of the 12496.68 area, an upside price objective related to buying pressure that emerged around the 8055.91 area earlier this year.
Traders also remain focused on the 12023.45, 11964.56, 11880.38, 11803.31, 11737.30, 11642.95, 11560.28, and 11533.51 areas during pullbacks higher, representing the retracements of the recent appreciating ranges that commenced around the 9005.00, 8905.84, 8815.01, and 8632.93 areas. A key level where buying pressure recently emerged is around the 11529.38 level, a test of the 11510.44 area that represents the 50% retracement of a historical depreciation from 19891.99 to 3128.89. Below current price activity, some potential areas of technical support include the 10200.39, 10139.11, and 10082.97 areas. Chartists are observing that the 50-bar MA (4-hourly) is bearishly indicating below the 100-bar MA (4-hourly) and below the 200-bar MA (4-hourly). Also, the 50-bar MA (hourly) is bearishly indicating below the 100-bar MA (hourly) and below the 200-bar MA (hourly).
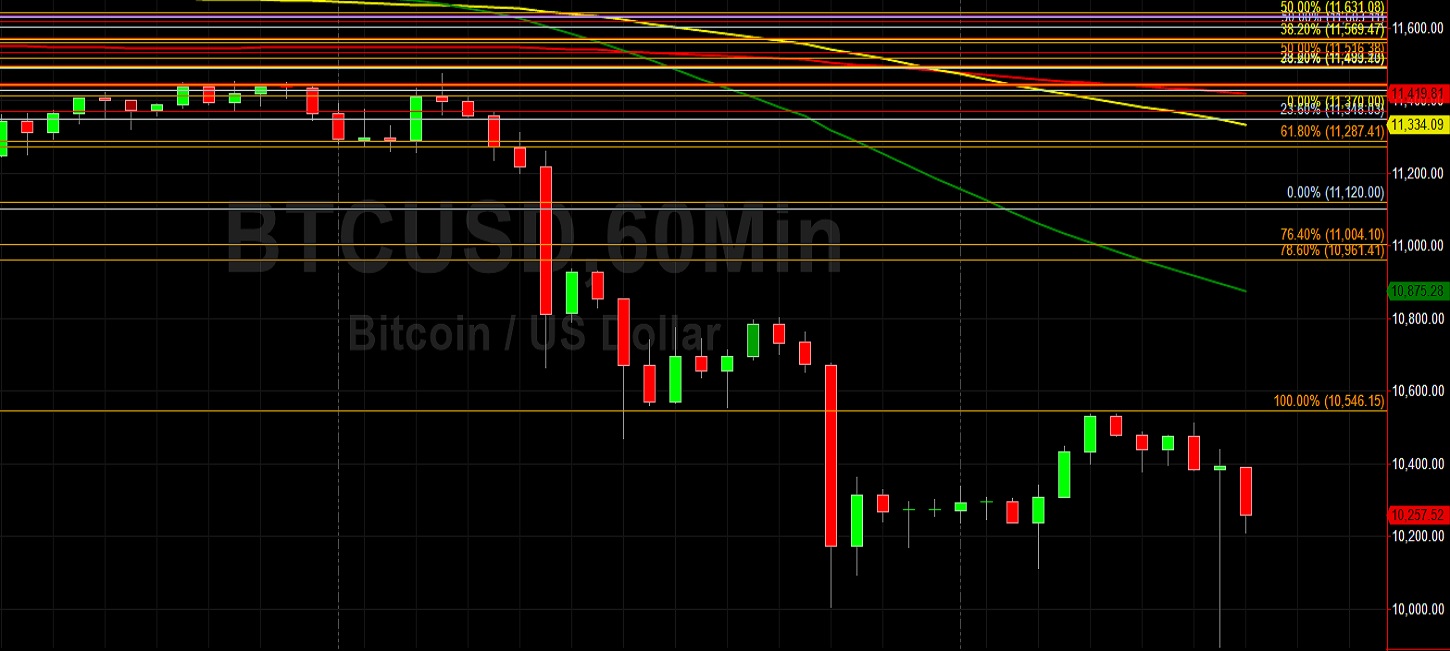
Price activity is nearest the 50-bar MA (4-hourly) at 11407.98 and the 50-bar MA (Hourly) at 10875.32.
Technical Support is expected around 10149.22/ 9816.32/ 9681.42 with Stops expected below.
Technical Resistance is expected around 10885.13/ 11190.92/ 11496.70 with Stops expected above.
On 4-Hourly chart, SlowK is Bullishly above SlowD while MACD is Bearishly below MACDAverage.
On 60-minute chart, SlowK is Bearishly below SlowD while MACD is Bullishly above MACDAverage.