Ethereum (ETH/USD) extended its recent pullback early in today’s North American session as the pair depreciated to the 416.20 area level after trading as high as the 436.00 area earlier in yesterday’s Asian session after Stops were elected above the 437.31 level, en route to a fresh 2020 high of 445.45. Buying pressure emerged during today’s North American session just above the 100-hour simple moving average after traders were unable to keep ETH/USD bid above the 50-bar simple moving average. The 396.69 area remains an important technical level, representing the 23.6% retracement of the historical depreciation from 1419.96 to 80.60. Stops were recently triggered below the 380.40 area, representing the 23.6% retracement of the appreciating range from 268.39 to 415.00, and stopped just short of testing the 374.08 and 372.25 levels, key retracement levels related to buying activity that emerged around the 241.62 and 233.85 levels. Following the pair’s recent run-up, important technical levels include the 412.61, 394.55, 392.29, 381.96, 375.87, 363.06, and 359.45 areas. Recently, the pair has encountered buying pressure around the 23.6% retracement of the appreciating range from 268.39 to 415.00. Downside retracement levels in this appreciating range include the 373.89, 364.70, 355.50, 344.13, and 342.42 areas.
After taking out the 437.31 level, one upside price objective is the 454.79 areas. Stops were recently elected above the 336.10, 337.33, 342.29, 350.44, 354.22, 366.48, and 369.26 areas during the move higher. Recently, bids emerged just above the 314.07 area, a level that represents the 50% retracement of the broad historical depreciation from the 547.54 to 80.60. A couple of interesting levels that traders will observe during retracements lower include the 301.20 and 301.40 areas, and they are related to buying pressure that emerged around the 241.62 and 319.86 areas. Likewise, the 312.82, 316.32, and 322.16 levels are areas with important technical significance. Chartists are observing that the 50-bar MA (4-hourly) is bullishly indicating above the 100-bar MA (4-hourly) and above the 200-bar MA (4-hourly). Also, the 50-bar MA (hourly) is bullishly indicating above the 100-bar MA (hourly) and above the 200-bar MA (hourly).
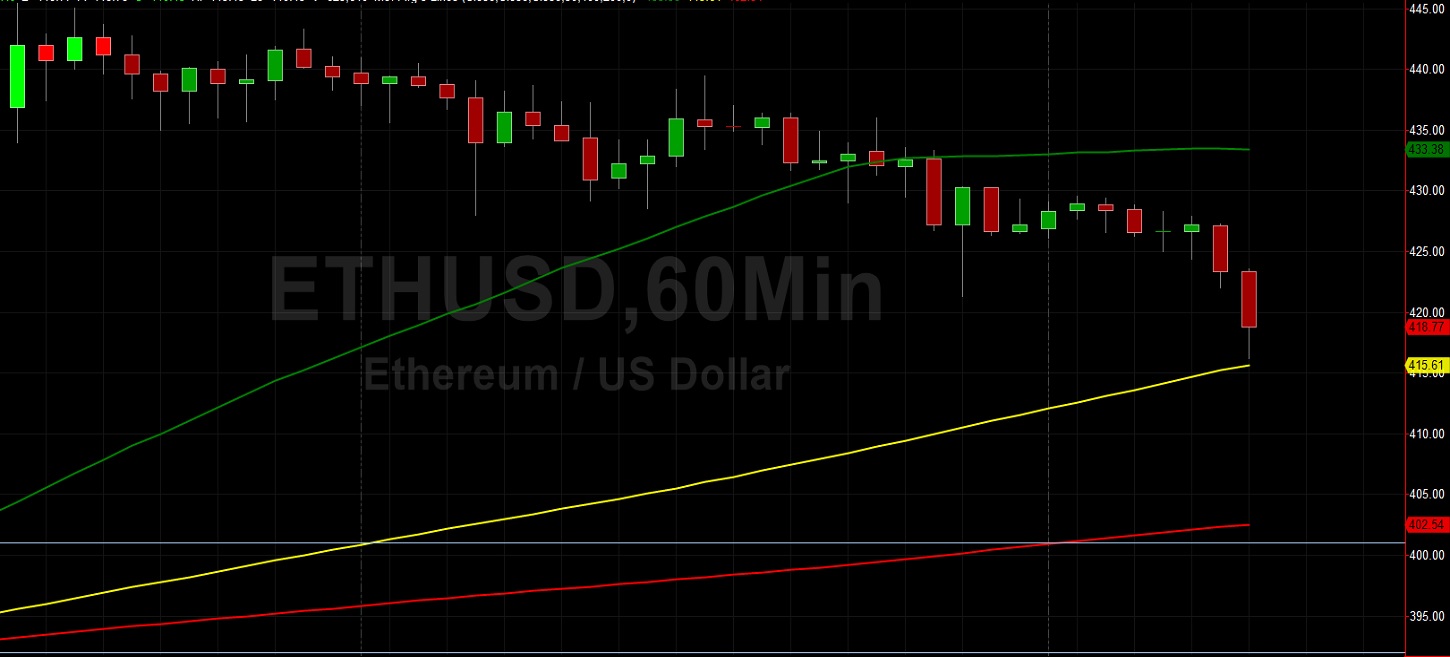
Price activity is nearest the 50-bar MA (4-hourly) at 403.18 and the 100-bar MA (Hourly) at 415.61.
Technical Support is expected around 349.75/ 331.95/ 315.08 with Stops expected below.
Technical Resistance is expected around 445.45/ 454.79/ 487.55 with Stops expected above.
On 4-Hourly chart, SlowK is Bearishly below SlowD while MACD is Bearishly below MACDAverage.
On 60-minute chart, SlowK is Bearishly below SlowD while MACD is Bearishly below MACDAverage.