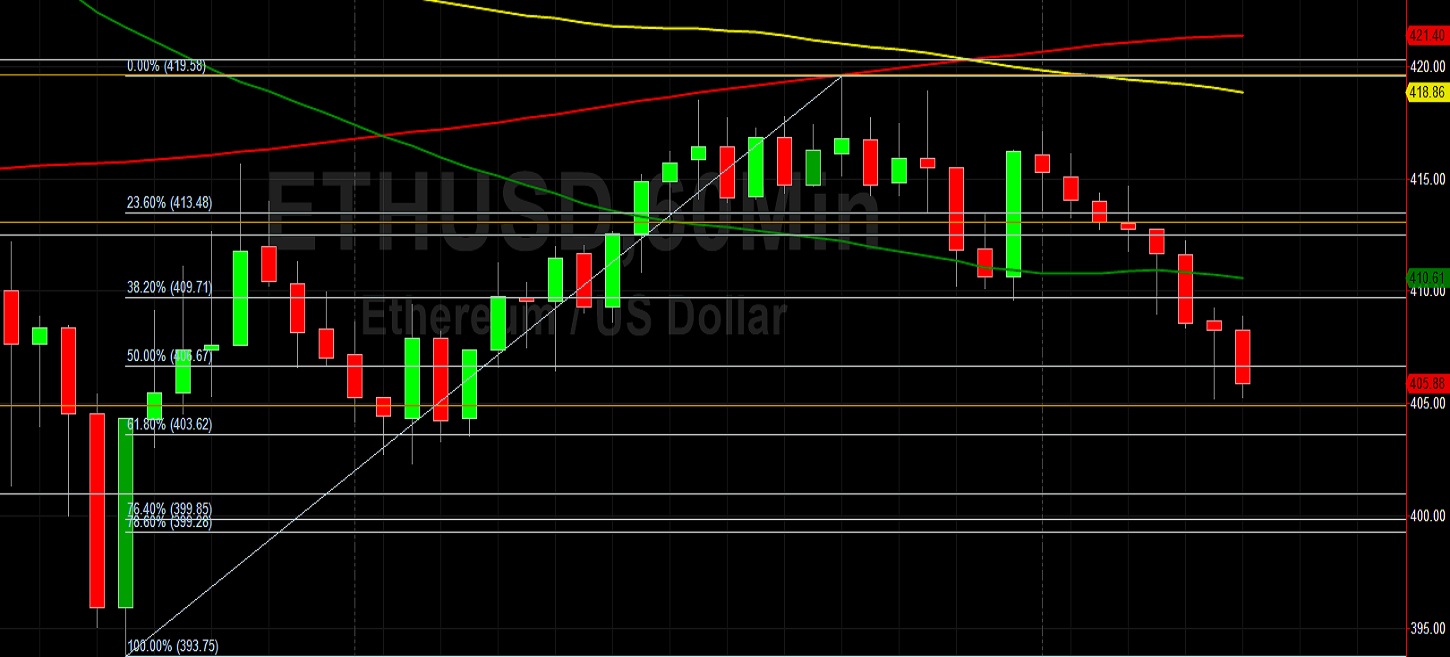
Ethereum (ETH/USD) was pressured lower early in today’s North American session as the pair depreciated to the 405.21 area after trading as high as the 419.58 area earlier in the Asian session, a test of the 200-hour simple moving average. The intraday low represented a test of the 404.91 area, representing the 23.6% retracement of the recent depreciation from 447.50 to 391.75. One short-term range that traders are monitoring is the recent appreciation from 393.75 to 419.58. Earlier this week, buying pressure emerged above the 392.67 area, representing the 38.2% retracement of the recent appreciation from 215.16 to 447.50. Following the pair’s recent depreciation from the 447.50 level to the 393.75 area, traders are eyeing upside retracement levels around the 413.05, 419.63, 426.20, 434.34, and 435.57 areas. The 396.69 area remains an important technical level, representing the 23.6% retracement of the historical depreciation from 1419.96 to 80.60. Following the pair’s recent run-up, important technical levels include the 414.17, 396.12, 392.67, 383.53, 376.90, 363.13, and 358.75 areas. Recently, the pair has encountered buying pressure around the 23.6% retracement of the appreciating range from 268.39 to 415.00. Downside retracement levels in this appreciating range include the 373.89, 364.70, 355.50, 344.13, and 342.42 areas.
Afte recently taking out the 445.45 level, one upside price objective is the 454.79 areas. Stops were recently elected above the 336.10, 337.33, 342.29, 350.44, 354.22, 366.48, and 369.26 areas during the move higher. Recently, bids emerged just above the 314.07 area, a level that represents the 50% retracement of the broad historical depreciation from the 547.54 to 80.60. A couple of interesting levels that traders will observe during retracements lower include the 301.20 and 301.40 areas, and they are related to buying pressure that emerged around the 241.62 and 319.86 areas. Likewise, the 312.82, 316.32, and 322.16 levels are areas with important technical significance. Chartists are observing that the 50-bar MA (4-hourly) is bullishly indicating above the 100-bar MA (4-hourly) and above the 200-bar MA (4-hourly). Also, the 50-bar MA (hourly) is bearishly indicating below the 100-bar MA (hourly) and below the 200-bar MA (hourly).
Price activity is nearest the 100-bar MA (4-hourly) at 406.01 and the 50-bar MA (Hourly) at 410.63.
Technical Support is expected around 349.75/ 331.95/ 315.08 with Stops expected below.
Technical Resistance is expected around 454.79/ 487.55/ 498.68 with Stops expected above.
On 4-Hourly chart, SlowK is Bearishly below SlowD while MACD is Bearishly below MACDAverage.
On 60-minute chart, SlowK is Bearishy below SlowD while MACD is Bearishly below MACDAverage.